|
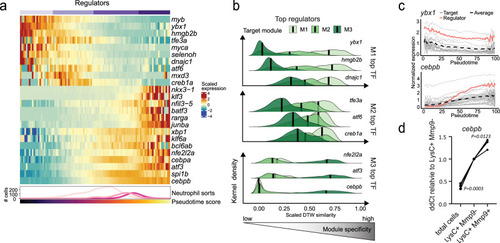
Cebpb expression is associated with neutrophil maturation in zebrafish. a Heatmap showing regulation of selected transcription factors (TFs) during neutrophil maturation. The bottom line-annotation shows the distribution of sorted subpopulations along the maturation trajectory (see Fig. 3f) and the bar shows the pseudotime score (see Fig. 3e). b Ridge plot showing top candidate regulators and their specificity to target genes in each module. Here, “module specificity” measures the similarity of the expression of a TF to all target genes in the neutrophil maturation modules compared to other TFs. It was calculated as 1 minus the dynamic time warping (DTW) distance and scaled relative to all other TFs. Thus, a high score on the x-axis indicates a target gene with a closely matching and specific expression pattern for the TF. The y-axis shows the distribution density for all genes in each module (M1, M2, M3; different colors). c Expression of top TFs ybx1, compared to its putative target genes in module M1 (top), and cebpb, compared to genes in M3 (bottom). d qPCR validation of cebpb expression in sorted lysC:CFP+/ mmp9:Citrine+and lysC:CFP+/ mmp9:Citrine- neutrophils. (n = 3, each sample sorted from a pool of 160 larva; repeated measures ANOVA).
|