IMAGE

Fig. 5

ID
ZDB-IMAGE-240229-140
Source
Figures for Kirchberger et al., 2024
Image
Figure Caption

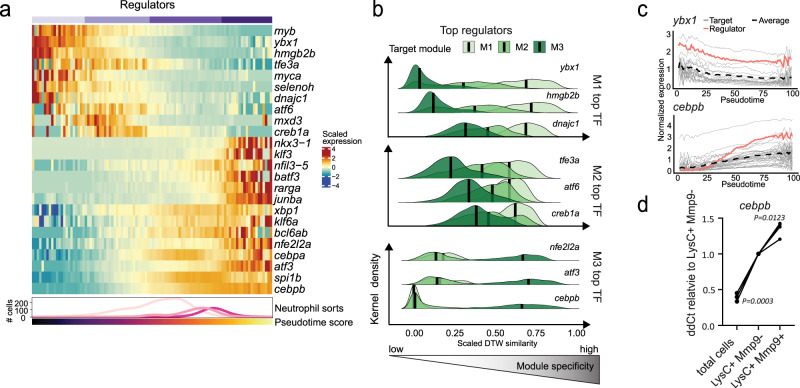
Fig. 5 Cebpb expression is associated with neutrophil maturation in zebrafish.

a Heatmap showing regulation of selected transcription factors (TFs) during neutrophil maturation. The bottom line-annotation shows the distribution of sorted subpopulations along the maturation trajectory (see Fig. 3f) and the bar shows the pseudotime score (see Fig. 3e). b Ridge plot showing top candidate regulators and their specificity to target genes in each module. Here, “module specificity” measures the similarity of the expression of a TF to all target genes in the neutrophil maturation modules compared to other TFs. It was calculated as 1 minus the dynamic time warping (DTW) distance and scaled relative to all other TFs. Thus, a high score on the x-axis indicates a target gene with a closely matching and specific expression pattern for the TF. The y-axis shows the distribution density for all genes in each module (M1, M2, M3; different colors). c Expression of top TFs ybx1, compared to its putative target genes in module M1 (top), and cebpb, compared to genes in M3 (bottom). d qPCR validation of cebpb expression in sorted lysC:CFP+/ mmp9:Citrine+and lysC:CFP+/ mmp9:Citrine- neutrophils. (n = 3, each sample sorted from a pool of 160 larva; repeated measures ANOVA).

Acknowledgments
This image is the copyrighted work of the attributed author or publisher, and ZFIN has permission only to display this image to its users. Additional permissions should be obtained from the applicable author or publisher of the image. Full text @ Nat. Commun.