|
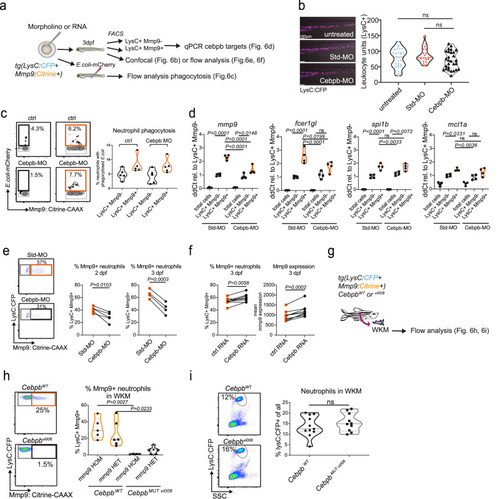
Cebpb regulates aspects of late neutrophil maturation in zebrafish. a–e Analyses of standard (Std)-morpholino (MO) or cebpb-morpholino treated Tg(lysC:CFP-NTR)vi002/ Tg(BACmmp9:Citrine-CAAX)vi003 larvae at 3 dpf (days post-fertilization). a Schematic drawing of subsequent experiments. b ImageJ analysis of LysC+ leukocyte numbers in the tail region of untreated, control (ctrl) standard morpholino or cebpb morpholino-injected larvae (n = 28; 23; 28 larvae, respectively, one-way ANOVA with Tukey´s test, P = 0.1343, F = 2.041, representative image shown to the left). Leica SP8 confocal images with a HC PL APO CS 10x/0.40 DRY; Zoom 0.85x. c In vivo phagocytosis assay with E.coli-mCherry injected into the caudal vein after cebpb morpholino treatment. Representative flow cytometry plots (left). d qPCR of selected target genes of C/ebp-β (selected from Xie et al.14.) in FACS-sorted cells (n = 4; sorted from 65-102 larvae each; one-way ANOVA with Tukey´s test; all P < 0.0001, df = 18) after morpholino treatment at 3 dpf. ns = not significant. e Representative flow cytometry plots show reduction in LysC+Mmp9+ neutrophils after cebpb morpholino treatment (left). Plots summarizing four independent experiments each with pools of approx. 20 larvae per group analyzed by flow cytometry at 2 and 3 dpf after morpholino treatment (right). Two-tailed paired t test. f Frequencies of LysC+Mmp9+ neutrophils and mean mmp9:Citrine expression are increased after cebpb full-length RNA overexpression. Analyzed by flow cytometry 3 dpf after mRNA injection (n = 7; pools of 20 larvae each), two-tailed paired t test. g−i Analyses of neutrophils from adult Cebpb mutant fish. WKM = whole kidney marrow. g Schematic drawing. WKM of adult Cebpb wildtype (cebpbWT) or Cebpb mutant (cebpbMUT vi006) Tg(lysC:CFP-NTR)vi002/ Tg(BACmmp9:Citrine-CAAX)vi003 fish was evaluated by flow cytometry. h Representative dot plots (left). Violin plot summarizing percentages of LysC+Mmp9+ neutrophils of all LysC+ neutrophils in mmp9:CitHOM (n = 5) mmp9:CitHET (n = 6) cebpbWT and mmp9:CitHOM (n = 4) mmp9:CitHET (n = 6) cebpbMUT vi006 kidneys. (One-way ANOVA with Tukey´s test P = 0.0006, F = 9.656, df = 17). i Representative dot plots (left). Violin plot summarizing percentages of LysC+ neutrophils of all live cells in cebpbWT (n = 11) and cebpbMUT vi006 (n = 10) kidneys (two-tailed unpaired t test; P = 0.3797).
|