|
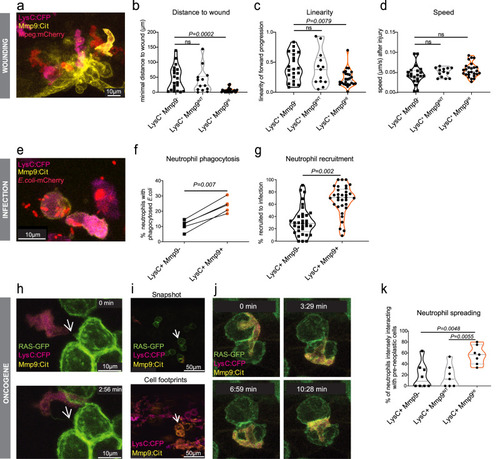
Mmp9+ neutrophils show functions of mature neutrophils. a−d Recruitment of neutrophils to an injury of the fin at 2 dpf (days post fertilization) lysC:CFP+mmp9:CitrineHI, lysC:CFP+mmp9:CitrineINT and lysC:CFP+mmp9:Citrine- neutrophil tracks (n = 21; 13; 26 cells, df = 57, respectively; n = 6 larvae; One-way ANOVA with Dunnett’s test) were analyzed over a 2 h period: b for distance to a wound ROI (P = 0.0002, F = 9.955), (c) linearity of forward progression (mean straight line speed/ track mean speed) (P = 0.0086, F = 5.172) and (d) speed (P = 0.1315, F = 2.103). ns = not significant. INT = intermediate expression; HI = high expression. e−g In vivo phagocytosis assays were performed by injecting mCherry-labeled E. coli into the caudal vein or otic vesicle of Tg(lysC:CFP-NTR)vi002/ Tg(BACmmp9:Citrine-CAAX)vi003 zebrafish larvae at 2 dpf. eE. coli were observed inside both, lysC:CFP+mmp9:Citrine+and lysC:CFP+mmp9:Citrine- neutrophils 6 hpi (hours post infection). f Phagocytosis experiments analyzed by flow cytometry (n = 5, each approx. 20 larvae; two-tailed paired t test, P = 0.007; df = 4); g Neutrophil recruitment to E.coli-mCherry injected into the otic vesicle of 3 dpf larvae was analyzed by confocal microscopy (n = 33, two-tailed paired t test, P = 0.002, df = 32). h−k Neutrophil- pre-neoplastic cell interactions were observed by confocal microscopy in Et(kita:GAL4)hzm1/ Tg(UAS:EGFP-HRAS_G12V)io006/ Tg(lysC:CFP-NTR)vi002/ Tg(BACmmp9:Citrine-CAAX)vi003 zebrafish larvae starting at 78 hpf. h Still Images of z-stack maximum projections from a time-lapse movie showing Mmp9+ neutrophils forming dynamic contacts with GFP+ kita tumor cells. White arrows point at a GFP+ cell tether. Z-stacks were acquired every 88 s. i Snapshots and cell footprints were taken from the same time-lapse movie (t = 5 h). Superimposition of lysC:CFP and mmp9:Citrine from all time frames generating neutrophil footprints (bottom). White arrow points out how the movements of an Mmp9+ neutrophil copied the outline of the RAS-GFP+ cluster seen in the snapshot (top). j Close-up clippings showing an Mmp9+ neutrophil spreading over the pre-neoplastic cell cluster marked by a white arrow in (i). k Quantification of neutrophil-pre-neoplastic interactions were performed from maximum projections of different time-lapse movies. The frequency of interacting neutrophils of each subpopulation (no, intermediate or high mmp9:Citrine levels) getting into close, intense interactions with GFP+ kita/RAS skin pre-neoplastic cells. (n = 8, one-way ANOVA, P = 0.0022, F = 8.561, df = 19).
|