FIGURE

Fig. 4

ID
ZDB-FIG-240229-136
Publication
Kirchberger et al., 2024 - Comparative transcriptomics coupled to developmental grading via transgenic zebrafish reporter strains identifies conserved features in neutrophil maturation
Other Figures
All Figure Page
Back to All Figure Page
Fig. 4

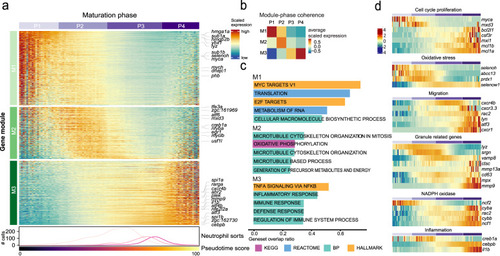
Trajectory analysis uncovers the underlying cell phases and governing gene modules.

a Heatmap showing differentially expressed genes (tradeSeq;40Padj < 0.001, top 1500 based on Wald-statistic) along the maturation trajectory. Cells have been allocated to four distinct phases (P1-P4) and into three distinct gene modules (M1-M3) by hierarchical clustering. The columns of the heatmaps correspond to 100 ordered discrete bins covering the maturation trajectory. The bottom line-annotation shows the distribution of sorted subpopulations along the maturation trajectory (see Fig. 3f) and the bar shows the pseudotime score (see Fig. 3e). b Heatmap summarizing average gene expression per module and phase (from a). c Top-5 enriched gene sets per module from the indicated source pathway databases (hypeR41 over-representation analysis). d Heatmaps of differentially expressed genes (excerpts from a) associated with selected neutrophil-related functional pathways.

Expression Data

Expression Detail
Antibody Labeling
Phenotype Data

Phenotype Detail
Acknowledgments
This image is the copyrighted work of the attributed author or publisher, and ZFIN has permission only to display this image to its users. Additional permissions should be obtained from the applicable author or publisher of the image. Full text @ Nat. Commun.