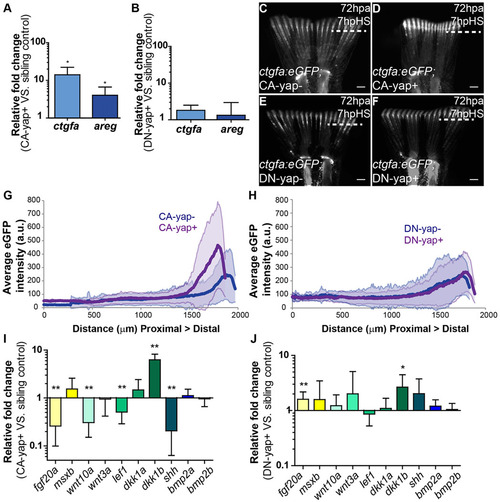
Transcriptional gene regulation induced by Yap. (A,B) qPCR determination of ctgfa and areg expression levels (relative to sibling controls) in blastemas of CA-yap positive (A) and DN-yap positive (B) transgenics upon single heat-shock at 72hpa. *P<0.01; two-tailed, non-parametric paired Wilcoxon test, logarithmic scale, base 10. (C-F) Representative ctgfa expression in double transgenics ctgfa:eGFP; CA-yap/DN-yap and siblings upon heat-shock at 72hpa, at 7hpHS. (C) CA-yap control; (D) CA-yap positive; (E) DN-yap control; (F) DN-yap positive. n=5 fish/condition. Scale bars: 500µm. Dashed lines indicate amputation plane. (G,H) Quantification of average eGFP intensity (in arbitrary units, a.u.) of individual rays including blastemas along the PD axis of double transgenics ctgfa:eGFP; CA-yap/DN-yap and siblings. (G) CA-yap positive and siblings; (H) DN-yap+ and siblings. n=80-90 rays, 5 fish/condition; shadows indicate the s.e.m. for each curve. (I,J) qPCR determination of fgf20a, msxb, wnt10a, wnt3a, lef1, dkk1a, dkk1b, shh, bmp2a and bmp2b expression levels (relative to sibling controls) in CA-yap positive (I) and DN-yap positive (J) transgenics upon single heat-shock at 72hpa. *P<0.05, **P<0.01; two-tailed, non-parametric paired Wilcoxon test, logarithmic scale, base 10. All RNA extractions were performed at 2hpHS. Mean±s.d. are shown.
|
