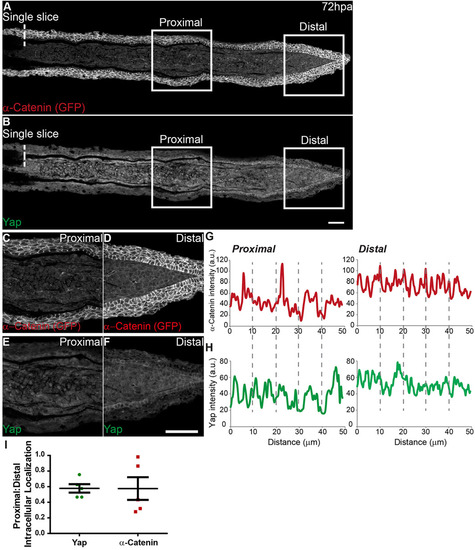
α-Catenin accumulates in distal blastema regions where Yap is mainly cytoplasmic. (A-F) Representative immunofluorescence with anti-Yap and anti-GFP antibodies in 72hpa longitudinal sections of α-Catenin transgenics. Owing to stronger expression intensity, transgenics were used instead of the α-Catenin antibody. (A) α-Catenin; (B) corresponding Yap expression. (C-F) High magnification images of the boxed areas in A,B showing α-Catenin (C, proximal; D, distal) and Yap (E, proximal; F, distal) expression. (G,H) Corresponding proximal and distal intensity profiles (in arbitrary units, a.u.) of the medial mesenchymal cells shown in C-F showing average intensity of α-Catenin (G) and Yap (H). (I) Quantification of changes in intracellular localization of Yap and α-Catenin across the PD axis by expressing a ratio between average intensities of proximal:distal Yap or α-Catenin of xz projections of respective mesenchymal cells. Mean±s.d. are shown. Dashed lines indicate amputation plane. n=5 sections, 3 fish. Scale bars: 50µm.
|
