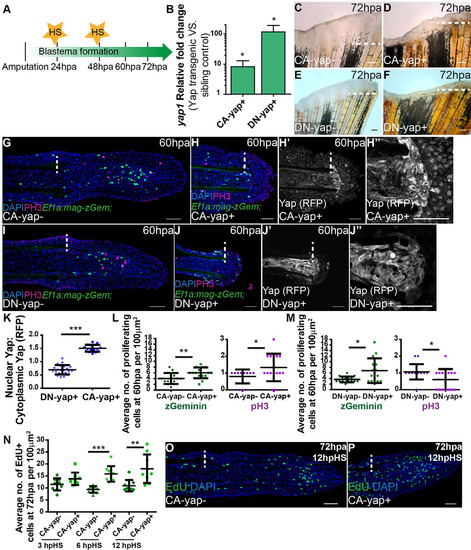
Yap influences proliferation in the blastema. (A) Experimental outline of heat-shock protocol used to access Yap functionality during regeneration. After amputations, fish were allowed to regenerate for 24h, the time at which the first heat-shock was performed. A second heat-shock at 48hpa was applied and phenotypes were assessed at 60hpa or 72hpa. The same protocol was applied to sibling controls. (B) qPCR determination of yap1 expression levels in blastemas of Yap transgenics versus respective siblings upon single heat-shock at 72hpa. RNA extraction was performed at 2hpHS. *P<0.01; two-tailed, non-parametric paired Wilcoxon test, logarithmic scale, base 10. (C-F) Representative brightfield images of Yap transgenics and siblings at 72hpa after the protocol shown in A was performed. (C) CA-yap control; (D) CA-yap positive; (E) DN-yap control; (F) DN-yap positive. n=5 fish/condition. Scale bars: 200µm. (G-J) Representative immunofluorescence with anti-pH3 in 60hpa longitudinal sections of double transgenics Ef1α:mag-zGeminin; CA-yap/DN-yap and siblings after the protocol shown in A was performed. (G) CA-yap control; (H) CA-yap positive; (I) DN-yap control; (J) DN-yap positive. (H′,H′′,J′,J′′) Corresponding transgenic CA-Yap and DN-Yap RFP expression. Siblings do not show RFP expression. Scale bars: 50µm. (K) Quantification of Yap-RFP intracellular localization in CA-yap and DN-yap transgenics by expressing a ratio between average intensities of nuclear Yap:cytoplasmic Yap of xz projections of respective mesenchymal cells. ***P<0.001; two-tailed, non-parametric Mann–Whitney test. n=16-23 sections, 3 fish/condition. (L,M) Quantification of average proliferation labeled with Geminin and pH3 occurring per 100µm2 in Ef1α:mag-zGeminin; CA-yap/DN-yap and siblings, at 60hpa. *P<0.05, **P<0.01; two-tailed, non-parametric Mann–Whitney test. n=15 sections, 3 fish/condition. (N) Quantification of average EdU-positive cells occurring per 100µm2 in CA-yap and siblings, at 72hpa in different times post heat-shock. **P<0.01, ***P<0.001; two-tailed, non-parametric Mann–Whitney test. n=9 sections, 3 fish/condition. (O,P) Representative immunofluorescence with EdU in 72hpa longitudinal sections of CA-yap and siblings after 12hpHS. (O) CA-yap control; (P) CA-yap positive. Scale bars: 50µm. Dashed lines indicate amputation plane. Mean±s.d. are shown.
|
