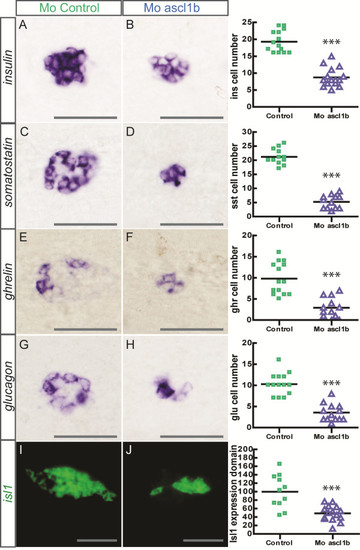
Impaired endocrine cell differentiation in ascl1b morphants. Ventral views with the anterior part to the left of WISH showing expression of insulin(A-B), somatostatin(C-D), ghrelin(E-F) and glucagon(G-H) in control (A, C, E, G) and ascl1b morphants (B, D, F, H) at 30 hpf. The quantifications on the right side of the figure represent the number of positive cells per embryo for controls and ascl1b morphants. (I-J) Confocal projections of ventral views of fluorescent WISH showing expression of isl1 in control (I) and ascl1b morphants (J) at 24 hpf. The quantification of isl1 expression domain is depicted on the right side of the figure. The graph shows the relative volume of isl1+ cells in control and ascl1b morphants, the mean of the volume occupied by the isl1+ cells in control morphants being arbitrarily set to 100%. Asterisks (***) indicate that the difference between controls and ascl1b morphants is statistically significant by Student’s t-test (P <0.001). Scale bars : 50 µm hpf, hours post fertilization; WISH, whole-mount in situ hybridization.
|
