|
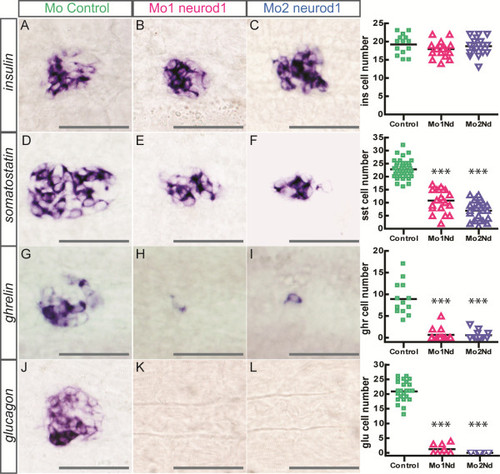
Impaired endocrine cell differentiation in neurod1 morphants. Ventral views with anterior to the left of WISH showing expression of insulin(A-C), somatostatin(D-F), ghrelin(G-I) and glucagon(J-L) in control (A, D, G, J), Mo1-neurod1(B, E, H, K) and Mo2-neurod1(C, F, I, L) morphants at 30 hpf. The quantifications on the right side of the figure represent the number of positive cells per embryo for controls and neurod1 morphants. Asterisks (***) indicate that the difference between cell number in controls and neurod1 morphants is statistically significant by Student’s t-test (P <0.001). Scale bars : 50 µm hpf, hours post fertilization; WISH, whole-mount in situ hybridization.
|