
Fig. S4
- ID
- ZDB-FIG-140618-6
- Publication
- Flasse et al., 2013 - Ascl1b and Neurod1, instead of Neurog3, control pancreatic endocrine cell fate in zebrafish
- Other Figures
- All Figure Page
- Back to All Figure Page
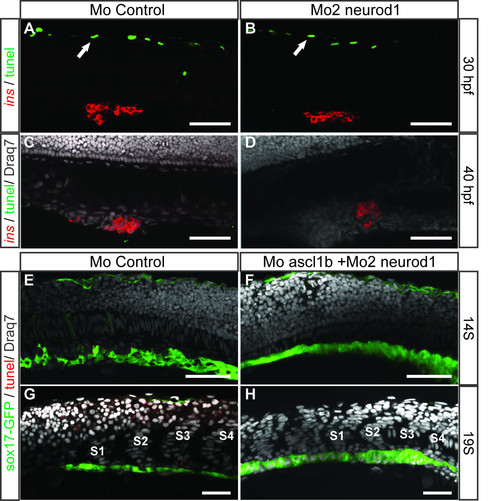
TUNEL assays on control and morphant embryos. (A–D) Confocal image projections of 30 hpf and 40 hpf control and neurod1 morphants after TUNEL labeling for apoptotic cells (in green) and immunodetection of insulin cells. The arrows highlight individual TUNEL+ cells in the neural tube. No TUNEL+ cells were found in the pancreatic region of control or neurod1 morphants at analyzed stages. (E–H) Confocal image projections of 14S and 19S control and ascl1b/neurod1 double morphants after TUNEL labeling for apoptotic cells (in red) and immunodetection of GFP cells. No TUNEL+ cells were found in the pancreatic region of control or morphants at analyzed stages. Somites 1 (S1) to somites 4 (S4) are shown on the panels G and H. |