
- Title
-
Embryonic alcohol exposure disrupts the ubiquitin-proteasome system
- Authors
- Weeks, O., Miller, B.M., Pepe-Mooney, B.J., Oderberg, I.M., Freeburg, S.H., Smith, C.J., North, T.E., Goessling, W.
- Source
- Full text @ JCI Insight

RNA-Seq identifies the ubiquitin proteasome system as a target of embryonic alcohol exposure.
(A) Schematic of RNA-Seq performed on 7 dpf whole-larval extracts following 0% or 1% EtOH exposure (12 hpf–5 dpf). (B) Heatmap of significantly dysregulated genes (Padj < 0.05; n = 1,603). (C) GOrilla GSEA identifies GO components enriched in the dysregulated gene set. (D) Heatmap of genes involved in proteasome-mediated, ubiquitin-dependent protein catabolism. Following EAE, these genes were significantly upregulated relative to controls. (E) ISH for psmb1 following 0% or 1% EtOH exposure (12–96 hpf). At 96 hpf, psmb1 expression is increased in the liver (black arrow) and intestine (white star). Scale bars: 100 μm. (F) Overview of the protocol for treatment and isolation of GFP+ hepatocytes via FACS sorting at 120 hpf. (G) ef1α-normalized qPCR of proteasome-related genes in GFP+ hepatocytes sorted by FACS (*P ≤ 0.05, **P ≤ 0.01, 2-sided t test; n = 5 per column). Data represent mean ± SEM. |
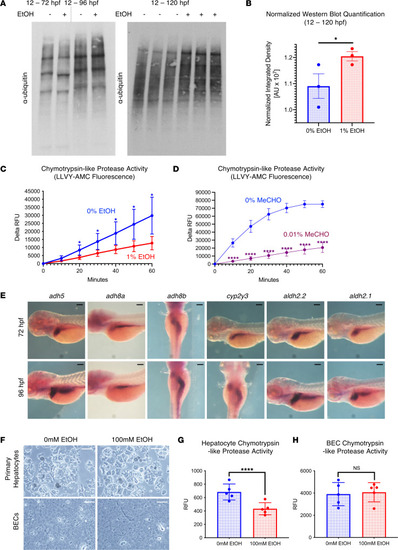
EtOH modulates the ubiquitin proteasome system and chymotrypsin-like proteasome peptidase activity in a cell type–specific manner.
(A) Western blot analysis of ubiquitylated protein and the 20S proteasome after exposure to 0% or 1% EtOH. See Supplemental Figure 2A for loading controls. (B) ImageJ quantification of normalized ubiquitylated protein levels in embryos treated with 0% and 1% EtOH (12–120 hpf; 1-sided unpaired t test, *P ≤ 0.05; n = 3). (C and D) Proteasome activity assay in protein extracts of from whole homogenized 5 dpf larvae. Chymotrypsin-like proteasome activity is impaired by 1% EtOH exposure (12 hpf–5 dpf) and 0.01% MeCHO exposure (104–120 hpf; *P < 0.05, ****P ≤ 0.0001, 2-sided t test per time point; n = 5). (E) Time course ISH for EtOH and MeCHO metabolism genes. For most genes, expression after 72 hpf is noted in the liver and intestine. (F) Confocal imaging of 2D-plated hepatic and biliary epithelial cell (BEC) organoids after 24 hours of treatment with 0 or 100mM EtOH. (G and H) Exposure to 100 mM EtOH impairs chymotrypsin-like proteasome activity in 2D hepatic organoids but not BECs (****P < 0.0001, 2-sided t test; n = 5). Scale bars: 100 μm. For B, G, and H, data represent mean ± SEM. For C and D, data represent mean ± SD. EXPRESSION / LABELING:
PHENOTYPE:
|

Disruptions to the ubiquitin proteasome system trigger proteasome compensation and produce transcriptional signatures similar to EAE.
(A and B) qPCR analysis of 5 dpf whole-larval extracts from DMSO and BTZ treatment (16 hours) (A) and 60 dpf whole-liver extracts from DMSO and Tm treatment (12 hours). Expression was normalized to ef1α. Discovery was determined using the 2-stage linear step-up procedure of Benjamini, Krieger, and Yekutieli, (**P ≤ 0.01, ***P ≤ 0.001, ****P ≤ 0.0001; each gene was analyzed individually using an unpaired 2-tailed t test). (C) ISH for bip following 0% and 1% EtOH (exposure window 12 hpf–5 dpf) treatment. EAE increases bip expression in the somites at 30 hpf (black arrowhead), and the liver, intestine, and brain from 96 to 120 hpf. (D) ISH for bip following DMSO and BTZ (exposure window 12 hpf–5 dpf) treatment. BTZ increases bip expression in the somites at 30 hpf (black arrowhead), and the liver, intestine, brain, and pancreas from 96 to 120 hpf. (E) ISH for bip in DMSO- and Tm-treated embryos. Tm increases bip expression in the endoderm, including the hepatoblasts (48 hpf, blue arrow), liver (120 hpf, blue arrow), and gut tube (120 hpf, white arrow). Scale bars: 100 μm. Data represent mean ± SD. |

Psmb1 and Psmc6 are required for craniofacial and nervous system development.
(A) Map of the transgenic insertion sites for psmb1hi2939 and psmc6hi3593 mutants. (B and C) Widefield imaging of psmb1hi2939 and psmc6hi3593 mutants. Both have craniofacial malformations, and psmc6–/– larvae have cardiac edema and blood pooling in the brain (C, white arrowhead). (D and E) Widefield imaging of Alcian blue–stained larvae. (D) psmb1–/– larvae (4 dpf) lack cartilages contributing to the lower jaw and have a reduced ethmoid plate (ep) and abnormal trabecula (t). Cartilage remnants (arrowhead) from the lower jaw appear in a subset of homozygotes. (E) psmc6–/– lack most cranial cartilage. (F–I) Measurements of craniofacial features obtained from ImageJ analysis of Alcian blue–stained larvae (4 dpf; ***P ≤ 0.001, ****P ≤ 0.0001, ordinary 1-way ANOVA with Dunnett’s multiple-comparison test following an observation of a difference in measurements between +/+ and –/– embryos; psmb1+/+, n = 3; psmb1+/–, n = 4; psmb1–/–, n = 4; psmc6+/+, n = 2; psmc6+/–, n = 5; and psmc6–/–, n = 5). (J) Anti-Hu/Anti-tubulin IHC at 72 hpf. psmb1–/– and psmc6–/– have abnormal brain structure and cranial ganglia (white star) and nerve development (white arrowheads). (K) ISH for neurod1 at 72 hpf. psmb1–/– and psmc6–/– have abnormal and missing vagal/cranial ganglia (white arrowheads). Scale bars: 100 μm. Data shown represent mean ± SD. EXPRESSION / LABELING:
PHENOTYPE:
|

Proteasome inhibition potentiates EtOH toxicity and exacerbates EtOH-induced craniofacial anomalies.
(A) Larval survival at 4 dpf after treatment with 1% EtOH (12 hpf–4 dpf) or 2.5 μM BTZ. Survival significantly decreases following exposure to 1% EtOH and BTZ in combination. (B) Edema prevalence in 5 dpf larvae exposed to a EtOH, BTZ, or both in increasing concentrations. For A and B, P values determined by a 2-sided Fischer’s exact test (*P < 0.05, **P ≤ 0.01, ****P ≤ 0.0001). (C) Alcian blue staining of 0% and 1% EtOH-treated (12 hpf–4 dpf) larvae in the presence of DMSO, BTZ, and MG132. BTZ and MG132, especially in the context of 1% EtOH exposure, induced Meckel’s cartilage malformations (black arrows). (D) Quantification of the percentage of affected individuals with Meckel’s cartilage abnormalities from each condition (**P < 0.01, 2-sided Fischer’s exact test). BTZ concentration = 2.5 μM (12 hpf–4 dpf). MG132 concentration = 5 μM (12 hpf–4 dpf). Scale bars: 100 μm. For D, percentages are based on n > 30 per group. See Supplemental Tables 4 and 5 for raw data and statistics related to A and B. |

psmb1 and psmc6 are required for cell survival in the developing brain, spinal cord, and pharyngeal arches.
(A) Confocal image analysis of acridine orange–stained (AO-stained) and TUNEL-stained psmb1hi2939 (50 hpf, 72 hpf, 96 hpf) mutants reveals increased apoptosis in the brain (top and middle rows, blue and white arrows) and spinal cord (bottom row, pink arrow). psmb1–/– have increased labeling in the pharyngeal arch area (middle row, green arrow). (B and C) ImageJ (NIH) quantification of fluorescent punctae in the brain and spinal cord of mutants following AO staining (****P ≤ 0.0001, unpaired 2-tailed t test; for +/+ vs. +/–, P > 0.05). For columns left to right, n = 10, 5, 6, 2, 8, 5 (B) and n = 9, 5, 8, 2, 9, 7 (C). (D–G) Confocal imaging and quantification of AO-stained larvae (75 hpf). Exposure to BTZ (2 μM, 12–75 hpf) alone resulted in significantly increased staining in the brain. Cotreatment with EtOH and BTZ increased the number of positive dots in the brain, spinal cord, and pharyngeal arch area relative to EtOH and BTZ alone. *P < 0.05, **P < 0.01, ***P < 0.001, ****P ≤ 0.0001, 2-way ANOVA with Tukey’s multiple-comparison test. From left, column sample n = 11, 9, 13, 9 (E); n = 12, 13, 12, 11 (F); and n = 12, 10, 13, 6 (G). Scale bars: 100 μm. Data represent mean ± SD. |

psmb1 and psmc6 are necessary for hepatopancreatic development.
(A) ISH for exocrine pancreas marker cpa5 and hepatocyte marker fabp10a. EtOH (1%) (12–72 hpf) reduced exocrine pancreas and liver size. (B and C) ImageJ quantification of pancreas and liver size (****P ≤ 0.0001, unpaired 2-tailed t test, n ≥13). (D and E) ISH for exocrine pancreas marker trypsin and hepatocyte markers prox1a and fabp10a in psmb1hi2939 and psmc6hi3593 (72 hpf) mutants. (F–I) Quantification of pancreas and liver size using ImageJ. psmb1+/–, psmb1–/–, and psmc6–/– have significantly reduced exocrine pancreas size. psmb1–/– and psmc6–/– have significantly reduced liver size (n > 4, ****P ≤ 0.0001, **P < 0.01, ordinary 1-way ANOVA with Dunnett’s multiple-comparison test). (J–L) ISH for liver marker fabp10a and exocrine pancreas marker trypsin, followed by quantification of organ size using ImageJ area calculation at 96 hpf. EtOH (1%) (12–96 hpf) significantly reduced liver and pancreas size. Treatment with BTZ significantly exacerbated the effects of EAE on liver and pancreas area (*P < 0.05, **P < 0.01, ***P < 0.001, 2-way ANOVA with Sidak’s multiple comparisons). BTZ concentration = 2.5 μM (12–96 hpf). Scale bars: 100 μm. From left, column sample n = 7, 16, 13 (F); n = 6, 20, 7 (G); n = 6, 20, 7 (H); n = 5, 12, 12 (I); n = 19, 21, 25, 19 (K); and n = 19, 19, 15, 25 (L). Data represent mean ± SD. EXPRESSION / LABELING:
PHENOTYPE:
|