
- Title
-
Jagged 2b induces intercellular signaling within somites to establish hematopoietic stem cell fate in zebrafish
- Authors
- Wada, Y., Tsukatani, H., Kuroda, C., Miyazaki, Y., Otoshi, M., Kobayashi, I.
- Source
- Full text @ Development
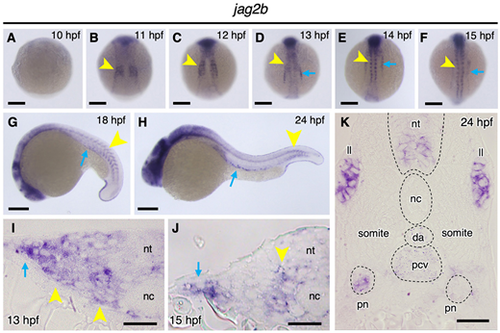
The expression domain of jag2b shifts spatiotemporally during somitogenesis. (A-H) Expression of jag2b in wild-type embryos at 10-15, 18 and 24 hpf. (I-K) Expression of jag2b in the somites at 13, 15 and 24 hpf. Yellow arrowheads and blue arrows in I and B-J indicate expression domains in somites and intermediate mesoderm, respectively. Dashed lines in K outline the neural tube (nt), notochord (nc), dorsal aorta (da), posterior cardinal vein (pcv) and pronephros (pn). ll, lateral line. Scale bars: 200 μm (A-H); 20 μm (I-K). EXPRESSION / LABELING:
|
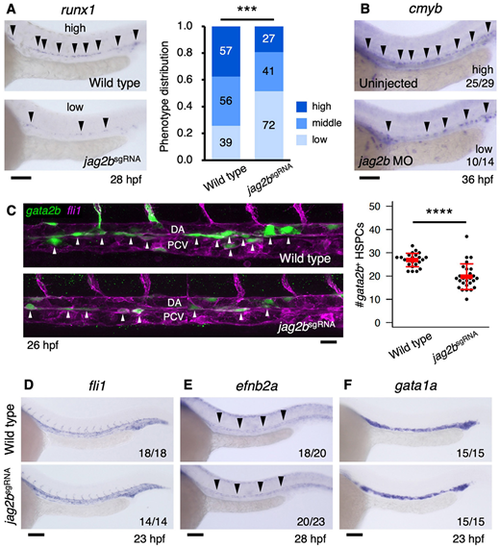
jag2bsgRNA embryos show a loss of HSCs. (A) Representative examples of runx1 expression in the DA of wild-type and jag2bsgRNA embryos. Graph shows the distribution of the ‘high’, ‘middle’ or ‘low’ runx1 expression phenotypes. ***P<0.001. (B) Expression of cmyb in the DA of an uninjected embryo and an embryo injected with jag2b MO. (C) gata2b-positive cells in wild-type and jag2bsgRNA embryos. White arrowheads indicate gata2b-positive cells in the ventral floor of the DA. Graph shows mean±s.d.; ****P<0.000001. HSPCs, hematopoietic stem/progenitor cells. (D-F) Expression of fli1 (a pan-endothelial marker), efnb2a (a DA marker) and gata1a (an erythroid marker) in wild-type and jag2bsgRNA embryos. Black arrowheads in A-C indicate expression in the DA. Scale bars: 100 μm (A,B,D-F); 20 μm (C). EXPRESSION / LABELING:
PHENOTYPE:
|
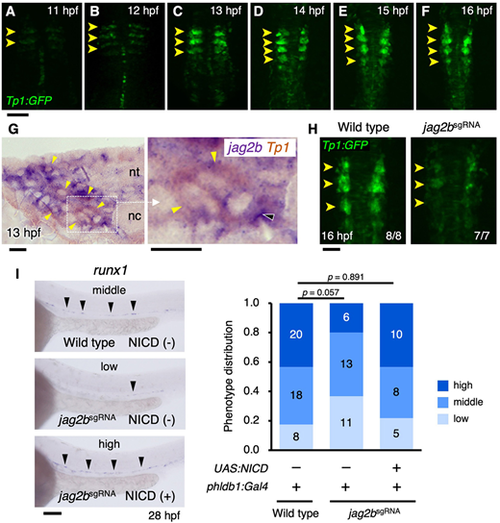
Jag2b activates Notch signaling in somites. (A-F) Time course of Tp1:GFP (a Notch reporter) expression in the somites of wild-type embryos. Dorsal views of the embryo are shown. Yellow arrowheads indicate Tp1:GFP expression in the somites. (G) Expression of jag2b and Tp1:GFP in the somites at 13 hpf. Black and yellow arrowheads indicate jag2b- and Tp1:GFP-expressing cells, respectively. A high-magnification view of the boxed region is shown on the right. (H) Expression of Tp1:GFP in the somites of wild-type and jag2bsgRNA embryos. Yellow arrowheads indicate Tp1:GFP-expressing somites. (I) Expression of runx1 in the DA of wild-type and jag2bsgRNA embryos expressing (+) or not expressing (−) NICD under the control of phldb1:Gal4 induction. Black arrowheads indicate runx1 expression in the DA. Graph shows the distribution of embryos exhibiting ‘high’, ‘middle’ or ‘low’ runx1 expression phenotypes. Scale bars: 100 μm (A-F,I); 10 μm (G); 50 μm (H). EXPRESSION / LABELING:
PHENOTYPE:
|
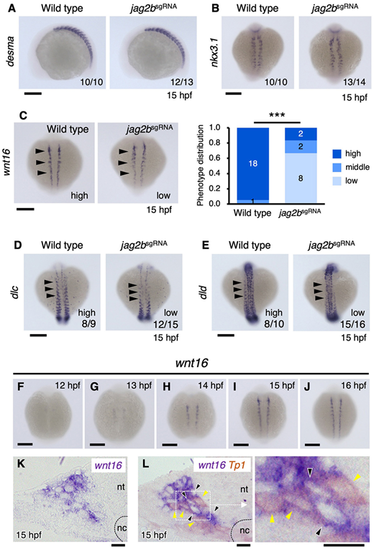
jag2bsgRNA embryos showed reduced wnt16 expression in the somites. (A,B) Expression of desma (a somite marker) and nkx3-1 (a sclerotome marker) in wild-type and jag2bsgRNA embryos. (C) Expression of wnt16 in wild-type and jag2bsgRNA embryos. Graph shows the distribution of embryos exhibiting ‘high’, ‘middle’ or ‘low’ runx1 expression phenotypes. ***P<0.001. (D,E) Expression of dlc and dld in wild-type and jag2bsgRNA embryos. Black arrowheads denote dlc or dld expression in the somite. (F-J) Time course of wnt16 expression in wild-type embryos. (K,L) Expression of wnt16 or both wnt16 and Tp1:GFP in the somites at 15 hpf. A high-magnification view of the boxed region in L is shown to the right. Black and yellow arrowheads indicate wnt16- and Tp1:GFP-expressing cells, respectively. Scale bars: 200 μm (A-J); 10 μm (K,L). EXPRESSION / LABELING:
PHENOTYPE:
|
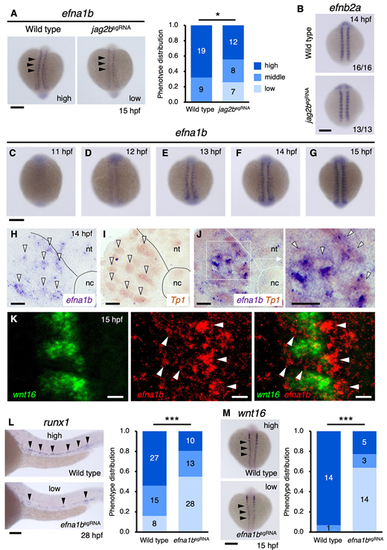
Jag2b regulates efna1b expression in the somites. (A) Expression of efna1b in wild-type and jag2bsgRNA embryos. Black arrowheads indicate efna1b expression in the somites. Graph shows the distribution of embryos exhibiting ‘high’, ‘middle’ or ‘low’ runx1 or wnt16 expression phenotypes. (B) Expression of efnb2a in the somites of wild-type or jag2bsgRNA embryos. (C-G) Time course of efna1b expression in wild-type embryos. (H-J) Expression of efna1b, Tp1:GFP or both in the somites at 14 hpf. White arrowheads indicate cells expressing efna1b, Tp1:GFP or both. A high-magnification view of the boxed region in J is shown to the right. (K) Expression of wnt16 (green) and efna1b (red) in the somites at 15 hpf. Dorsal views of the embryo are shown. White arrowheads indicate instances of an efna1b-expressing cell adjacent to a wnt16-expressing cell. (L,M) Expression of runx1 in the DA and wnt16 in the somite of wild-type and efna1bsgRNA embryos. Black arrowheads indicate runx1 expression in the DA (L) and wnt16 expression in the somites (M). Graphs show the distribution of embryos exhibiting ‘high’, ‘middle’ or ‘low’ runx1 or wnt16 expression phenotypes. *P<0.05; ***P<0.001. Scale bars: 200 μm (A-G,M); 10 μm (H-J); 20 μm (K); 100 μm (L). EXPRESSION / LABELING:
PHENOTYPE:
|

Ephrin A1b regulates HSC specification by regulating wnt16 expression. (A,B) Expression of runx1 in the DA or wnt16 in the somites of uninjected embryos or embryos injected with efna1b mRNA. (C,D) Expression of runx1 in the DA of wild-type and jag2bsgRNA uninjected embryos or embryos injected with efna1b mRNA (C) or efna1bsgRNA uninjected embryos or embryos injected with wnt16 mRNA (D). Black arrowheads indicate runx1 expression in the DA (A,C,D) and wnt16 expression in the somites (B). Graphs in C and D show the distribution of embryos exhibiting ‘high’, ‘middle’ or ‘low’ runx1 expression phenotypes. *P<0.05; ***P<0.001; n.s., not significant. Scale bars: 100 μm (A,C,D); 200 μm (B). |

Schematic of intercellular signaling in the somites. Expression of jag2b is initiated at 11 hpf in the somites, and Jag2b protein activate Notch signaling in adjacent somitic cells (∼13 hpf). Notch-activated cells then express efna1b (∼13 hpf ), and Ephrin A1b protein transduces signals to adjacent somitic cells to drive wnt16 expression (∼14 hpf ). Wnt16 regulates dlc and dld expression in the ventral domain of the somite (sclerotome), where angioblasts receive Dlc/Dld signaling to become hemogenic endothelial cells (∼16 hpf ). Hemogenic endothelial cells express gata2b (∼18 hpf ) and arise in the ventral floor of the DA (∼23 hpf ). The cross-hatched region within the somite denotes the adaxial domain where jag2b-expressing slow muscle precursors are located. Colors of cells relate to the protein signal scheme above. nc, notochord; nt, neural tube. |