
Fig. 2
|
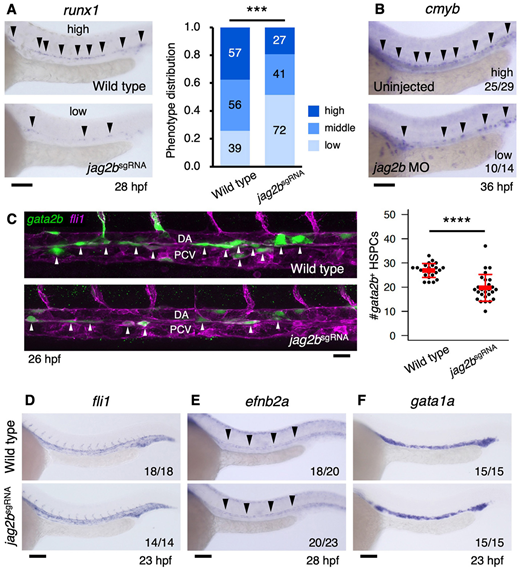
Fig. 2 jag2bsgRNA embryos show a loss of HSCs. (A) Representative examples of runx1 expression in the DA of wild-type and jag2bsgRNA embryos. Graph shows the distribution of the ‘high’, ‘middle’ or ‘low’ runx1 expression phenotypes. ***P<0.001. (B) Expression of cmyb in the DA of an uninjected embryo and an embryo injected with jag2b MO. (C) gata2b-positive cells in wild-type and jag2bsgRNA embryos. White arrowheads indicate gata2b-positive cells in the ventral floor of the DA. Graph shows mean±s.d.; ****P<0.000001. HSPCs, hematopoietic stem/progenitor cells. (D-F) Expression of fli1 (a pan-endothelial marker), efnb2a (a DA marker) and gata1a (an erythroid marker) in wild-type and jag2bsgRNA embryos. Black arrowheads in A-C indicate expression in the DA. Scale bars: 100 μm (A,B,D-F); 20 μm (C).