
- Title
-
Down-regulation of interleukin 7 receptor (IL-7R) contributes to central nervous system demyelination
- Authors
- Lei, X., Cai, S., Chen, Y., Cui, J., Wang, Y., Li, Z., Li, Y.
- Source
- Full text @ Oncotarget
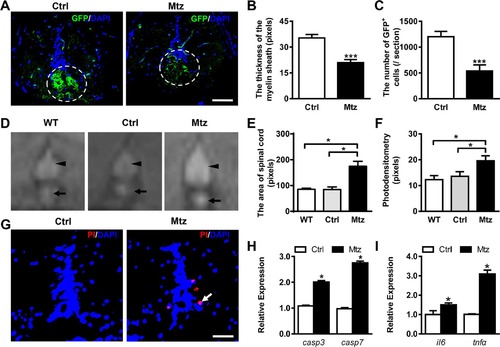
Metronidazole treatment leads to effective demyelination in adult Tg (mbp:nfsB-egfp) zebrafish. (A) Immunostaining of GFP expression on transverse sections taken through the spinal cords of the control Tg (mbp:nfsB-egfp) (Ctrl, left view) and the metronidazole treated Tg (mbp:nfsB-egfp) (Mtz, right view). Note that there were fewer GFP-positive cells that failed to form the concentric rings structure in the spinal cord in Mtz group. (B and C) The quantitative comparison of the thickness of the myelin sheath (B) and the number of GFP positive cells (C) between the control (n = 8) and metronidazole treated adults (n = 9). There were statistically significant differences between the two groups (Student’s t-test, ***P < 0.001). (D) The images of spinal cords (arrowheads) and notochord remnants (arrows) taken using MRI scanning from wild-type (WT), control Tg (mbp:nfsB-egfp) adult (Ctrl) and metronidazole treated Tg (mbp:nfsB-egfp) adult (Mtz). (E and F) The statistical analysis of the area and photodensity of the spinal cords from three groups (n = 3 in each group). Note that the area and photodensity in Mtz group are significantly increased compared to the WT and Ctrl groups (ANOVA, *P < 0.05). (G) The TUNEL staining on transverse section taken through the spinal cords of control Tg (mbp:nfsB-egfp) adult (Ctrl, left view) and metronidazole treated Tg (mbp:nfsB-egfp) (Mtz, right view). (H) The relative expression of capspase3 (casp3) and caspase7 (casp7) mRNA in Ctrl and Mtz groups. (I) The relative expression of interleukin 6 (il6) and tumor necrosis factor alpha (tnfα) mRNA in Ctrl and Mtz groups. Note that the expression of casp3, casp7, il6 and tnfα in the Mtz group is significantly increased compared to the Ctrl group (n = 3 in each group; Student’s t test, *P < 0.05). Dorsal is up in A, D and G. Scale bar: A, 50 μm; G, 100 μm. |

ZFIN is incorporating published figure images and captions as part of an ongoing project. Figures from some publications have not yet been curated, or are not available for display because of copyright restrictions. |
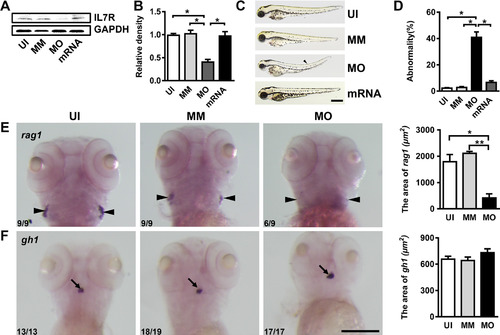
IL-7R-targeted morpholino oligonucleotides cause abnormal phenotypes and affect thymus development. (A) The expression of IL-7R protein of uninjected (UI), mismatch control (MM), IL-7R-morphant (MO) and IL-7R-rescue (mRNA) groups at 72 hpf. (B) Note that the IL-7R protein expression was significantly suppressed in IL-7R-morphants (ANOVA, *P < 0.05). (C) The gross development of UI, MM, MO and IL-7R-rescue (mRNA) embryos at 72 hpf. Some of the IL-7R-morphants show a slight curve in body axis (arrowhead). (D) The rate of abnormal phenotype increases in MO group (ANOVA, *P < 0.05). (E and F) The images of whole mount in-situ hybridization with mRNA probes recombination activating gene 1 (rag1) and growth hormone1 (gh1) in UI, MM and MO at 5 dpf. E. Note that the expression of rag1 is significantly decreased in IL-7R morphants (E; ANOVA, *P < 0.05, **P < 0.01) while the gh1 positive signals are similar among all three groups (F). Scale bar: C. 500 μm; E. and F., 200 μm. EXPRESSION / LABELING:
PHENOTYPE:
|

IL-7R knockdown delays myelination in the nervous system. (A) The images of mbp mRNA expression in embryos from uninjected (UI), mismatch control (MM) and IL-7R morphant (MO) at 3 dpf. The second and third lines are magnified images in lateral view and dorsal view. Note that the mbp-expressing cells in IL-7R morphant are absent at 3 dpf (asterisks). (B) The images of mbp expression in the spinal cord (arrows) and lateral line nerves (arrowheads) of the larvae from the UI, MM and MO groups at 4dpf. The mbp positive cells distribute along the lateral line nerves and the spinal cord in UI and MM larvae. In MO larva, the mbp signals are only detected along the spinal cord. (C) The relative expression of mbp mRNA expression among three groups using qRT-PCR at 4 dpf (n = 3 in each group). Note that the expression level in the MO group is decreased compared to the UI and MM groups (ANOVA, *P < 0.05). (D) The expression of MBP protein by western blotting at 4 dpf. Scale bar: A. and B., 200 μm. EXPRESSION / LABELING:
PHENOTYPE:
|
|
ZFIN is incorporating published figure images and captions as part of an ongoing project. Figures from some publications have not yet been curated, or are not available for display because of copyright restrictions. |
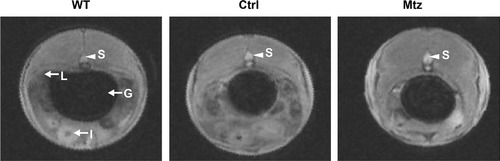
Images of MRI scanning of cross-sections of the wild-type adult (WT), control Tg (mbp:nfsB-egfp) (Ctrl) and metronidazole treated Tg (mbp:nfsB-egfp) adults (Mtz). Abbreviations: S, spinal cord; G, gas bladder; L, liver; I, intestine. |