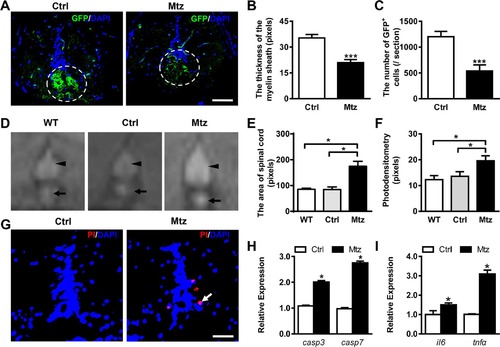
Metronidazole treatment leads to effective demyelination in adult Tg (mbp:nfsB-egfp) zebrafish. (A) Immunostaining of GFP expression on transverse sections taken through the spinal cords of the control Tg (mbp:nfsB-egfp) (Ctrl, left view) and the metronidazole treated Tg (mbp:nfsB-egfp) (Mtz, right view). Note that there were fewer GFP-positive cells that failed to form the concentric rings structure in the spinal cord in Mtz group. (B and C) The quantitative comparison of the thickness of the myelin sheath (B) and the number of GFP positive cells (C) between the control (n = 8) and metronidazole treated adults (n = 9). There were statistically significant differences between the two groups (Student’s t-test, ***P < 0.001). (D) The images of spinal cords (arrowheads) and notochord remnants (arrows) taken using MRI scanning from wild-type (WT), control Tg (mbp:nfsB-egfp) adult (Ctrl) and metronidazole treated Tg (mbp:nfsB-egfp) adult (Mtz). (E and F) The statistical analysis of the area and photodensity of the spinal cords from three groups (n = 3 in each group). Note that the area and photodensity in Mtz group are significantly increased compared to the WT and Ctrl groups (ANOVA, *P < 0.05). (G) The TUNEL staining on transverse section taken through the spinal cords of control Tg (mbp:nfsB-egfp) adult (Ctrl, left view) and metronidazole treated Tg (mbp:nfsB-egfp) (Mtz, right view). (H) The relative expression of capspase3 (casp3) and caspase7 (casp7) mRNA in Ctrl and Mtz groups. (I) The relative expression of interleukin 6 (il6) and tumor necrosis factor alpha (tnfα) mRNA in Ctrl and Mtz groups. Note that the expression of casp3, casp7, il6 and tnfα in the Mtz group is significantly increased compared to the Ctrl group (n = 3 in each group; Student’s t test, *P < 0.05). Dorsal is up in A, D and G. Scale bar: A, 50 μm; G, 100 μm.
|
