
- Title
-
Multifactorial Origins of Heart and Gut Defects in nipbl-Deficient Zebrafish, a Model of Cornelia de Lange Syndrome
- Authors
- Muto, A., Calof, A.L., Lander, A.D., and Schilling, T.F.
- Source
- Full text @ PLoS Biol.
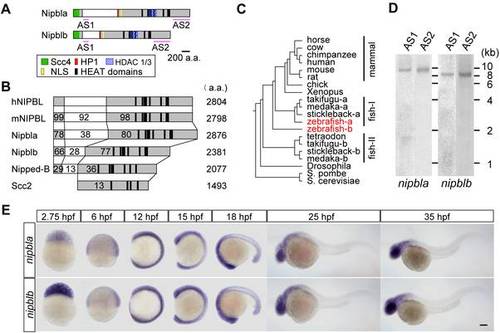
Zebrafish nipbl genes. (A) Domain structure of Nipbla and Nipblb proteins. N- and C-terminal conserved regions are shown in gray; predicted domains and motifs as colored boxes. Pink lines indicate positions used for antisense RNA probes. (B) Comparison of Nipbl orthologs among species. Numbers indicate amino acid identity to human NIPBL, as determined by Clustal W analysis (http://clustalw.ddbj.nig.ac.jp/top-j.htm l). (C) Phylogenic tree of Nipbl proteins, constructed by the NJ method (http://www.ddbj.nig.ac.jp/), using full-length amino acid sequences from the Ensembl database. (D) Expression of nipbla and nipblb mRNAs at 9 hpf was analyzed by Northern blotting (10 µg total RNA per lane) using DIG-labeled antisense RNA probes. Two different probes for each gene (see panel A) were used. (E) Expression patterns analyzed by ISH with nipbla (upper) and nipblb (lower) AS1 probes at indicated stages. Views are lateral, with anterior to the top (2.75–15 hpf) and left (18–35 hpf). Scale bar: 100 μm. |

Morpholino knock-down of Nipbls. (A) Total protein lysates (10 embryos per lane) from uninjected embryos or embryos injected with either 0.5 ng of nipbla-MO1 or 0.5 ng of nipblb-MO1 were prepared at 10 and 24 hpf and subjected to Western blotting with anti-Nipbla and Nipblb-antibodies. Positions of Nipbla and Nipblb proteins are shown on the right. A lower band recognized by anti-Nipbla antibody (*) at 24 hpf is not reproducibly observed and may be a degradation product of Nipbla. (B) Activities of nipblb-MOs at earlier stages. EGFP reporter RNAs (100 pg/embryo)—nipbla-5′-UTR-EGFP (upper panels) and nipblb-52-UTR-EGFP (lower panels)—were injected alone or together with either nipblb-MO1 or nipblb-MO2 (1 ng/embryo), and EGFP fluorescence measured at 10–11 hpf. Views are lateral, with anterior and dorsal to the top and right, respectively. (C) Morphology of living embryos at indicated stages. Uninjected embryos, control embryos co-injected with 0.75 ng each of two 5-mis-nipbl-MOs, and embryos injected with either nipbla-MO1 (0.75 ng) or nipblb-MO1 (0.75 ng) alone or together (nipbla/b-morphants) are shown. Pericardial edema and tail defects are indicated by asterisks and arrowheads, respectively. Views are lateral, with dorsal to the top. Scale bar: 100 μm. |
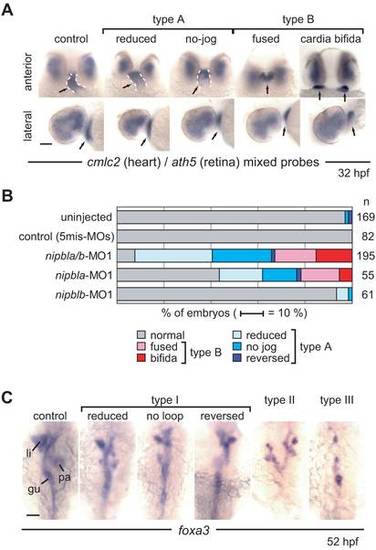
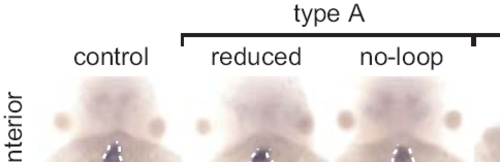
Effects of nipbl-MOs on heart and gut development. (A) Heart morphology was assessed at 32 hpf by cmlc2 expression. Head-heart regions of control embryos (leftmost panels) and nipbla/b-morphants are shown in anterior (upper panels) and lateral (lower panels) views. Type A embryos form heart tubes (dashed white lines) but jogging to the left is incomplete (“reduced”) or absent (“no-jog”). Type B embryos fail to form heart tubes, and fusion of cardiac precursors at the midline is partial (“fused”) or entirely lacking (“cardia bifida”). Simultaneous detection of ath5 expression throughout the dorsal and temporal retina in all embryos indicates no significant developmental delay in nipbla/b-morphants. Arrows point to heart tube or cardiac precursors. (B) Frequencies of different heart phenotypes in morphants; numbers (n) of embryos are on the right. (C) Gut and visceral organ morphology was assessed at 52 hpf by foxa3 expression. Dorsal views, with anterior to the top, are shown for control embryos (leftmost panel) and nipbla/b-morphants. Type I embryos have thin gut tubes as well as small liver and pancreas. Looping of the gut tube is also reduced, absent (no loop), or reversed. In type II embryos, anterior gut tubes are split, and associated visceral organs are bilaterally duplicated. Type III embryos have few or no cells expressing foxa3, and lack a gut tube. Scale bars: 50 μm. |
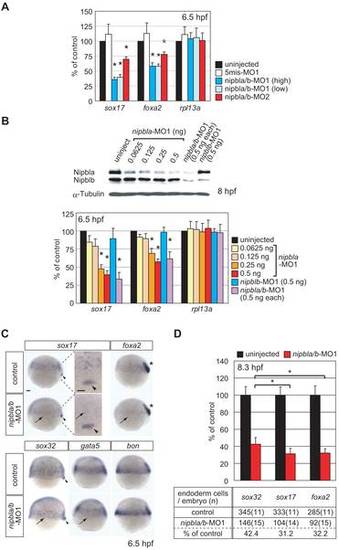
nipbls regulate the expression of endodermal genes. (A–B) Expression of sox17, foxa2, and rpl13a in nipbla/b-morphants at 6.5 hpf. mRNA levels were measured by Q-PCR, normalized to that of ef-1a, and expressed relative to values in uninjected embryos (n = 3, mean ± S.E.M.; * p<0.05 by paired t test). (A) Morpholino specificities. Uninjected embryos (black), control embryos injected with 2 ng each of 5mis-nipbla-MO1 and 5mis-nipblb-MO1 (white), and morphants co-injected with high doses (2 ng each; blue) or low doses (0.5 ng each; light blue) of nipbla-MO1 and nipblb-MO1, or with nipbla-MO2 (1.5 ng) and nipblb-MO2 (0.5 ng) (red). (B) Effects of single knockdown of Nipbla and Nipblb. Upper: protein levels of Nipbla and Nipblb at 8 hpf in morphants injected with indicated amounts of nipbla-MO1 and/or nipblb-MO1. Lower: Q-PCR analysis of sox17, foxa2, and rpl13a expression in uninjected embryos (black) and embryos injected with indicated amounts (0.0625–0.5 ng) of nipbla-MO1, with 0.5 ng of nipblb-MO1 alone, or with a mixture of 0.5 ng each of nipbla-MO1 and nipblb-MO1 (purple). (C) Analysis of endodermal gene expression by ISH. Control embryos (upper) and nipbla/b-morphants (lower) were analyzed at 6.5 hpf with sox17, foxa2, sox32, gata5, and bon Probes. Expression of all except bon was markedly (sox17, foxa2) or weakly (sox32, gata5) reduced in endoderm cells (arrows) of nipbla/b-morphants, but not in dorsal forerunner cells (sox17 and sox32; arrowheads) or axial mesoderm (foxa2; asterisks), and this is more clearly shown in higher magnification panels of sox17 expression at dorsal marginal regions. Views are lateral, with dorsal to the right, except the higher magnification panels (dorsal view, with anterior to the top.). Scale bar: 50 µm. (D) Endodermal cells, as detected by ISH with sox32, sox17, or foxa2 probes, were counted in uninjected embryos (black) and nipbla/b-morphants (red) at 8.3 hpf (80% epiboly). The bar graph expresses the data relative to average numbers in uninjected embryos (mean ± SD; * p<0.001). The table underneath presents the average numbers of endodermal cells per embryo, along with the number of embryos counted (in parentheses).EXPRESSION / LABELING:
PHENOTYPE:
|
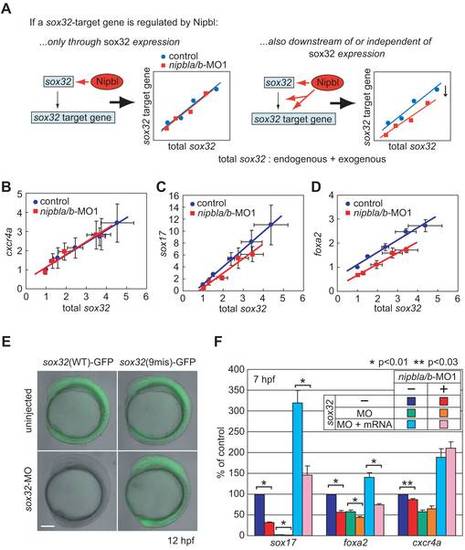
Multiple modes of regulation of sox17 and foxa2 by nipbls. (A–D) Embryos were injected with increasing (3.125–25 pg) amounts of in vitro synthesized sox32 mRNA, and either 5-mis-nipbl-MO1 mixture (0.75 ng each: control) or nipbl-MO1 mixture (0.75 ng each: nipbla/b-MO1). mRNA levels for the sox32-target genes sox17, foxa2, and cxcr4a were quantified at 6.5 hpf by Q-PCR, normalized to ef-1a, and expressed relative to levels in embryos not treated with exogenous sox32 mRNA. As sox32 induces its own expression [38], target gene expression was determined as a function of total sox32 (endogenous and exogenous, both measured directly), and not just the amount of sox32 RNA injected. (A) Top: expected behavior of a sox32 target gene that is not itself affected by nipbls. The same relationship between sox32 level and target gene expression should be observed in control and nipbla/b-morphant embryos. Right: expected behavior of sox32 target gene that is independently acted upon by nipbls (either directly, or because nipbls control the expression of other inputs to the gene). In this case, the relationship between sox32 level and target gene expression will be shifted in nipbla/b-morphant embryos. (B) cxcr4a displays the expected behavior of a sox32 target gene that is not itself affected by nipbls. (C,D) sox17 and foxa2 display the expected behavior of sox32 target genes that are independently sensitive to nipbl function. In panels B–D, data are presented as mean ± S.E.M (n = 3). Dose-response relationships were well fit by straight lines (least-squares regression yielded values of r2>0.95 in all cases). (E, F) To eliminate any indirect effects of Nipbl reduction on gene expression through sox32, endogenous Sox32 protein was removed with a sox32-MO (5 ng) and replaced with sox32-9mis mRNA (10 pg), lacking the MO binding site for sox32-MO, and endodermal gene expression was examined by Q-PCR. (E) Embryos coinjected with sox32-MO and either a wild-type sox32(WT)- or mutated sox32(9mis)-GFP reporter construct show that a 9-base-mutation is sufficient to escape suppression of translation by sox32-MO. Lateral views at 12 hpf. Scale bar: 100 μm. (F) Effects of Nipbl reduction on expression of endodermal genes (sox17, foxa2, and cxcr4a) were examined in control (blue, red), Sox32-deficient (MO; green, orange), and Sox32-restored (MO+mRNA; light blue, pink) embryos at 7 hpf (n = 4, mean ± S.E.M.; * p<0.01 and ** p<0.03 by paired t test). The data show that induction of sox17 and foxa2 by exogenous Sox32 is markedly Nipbl-dependent, whereas induction of a different Sox32 target, cxcr4a, is not. |
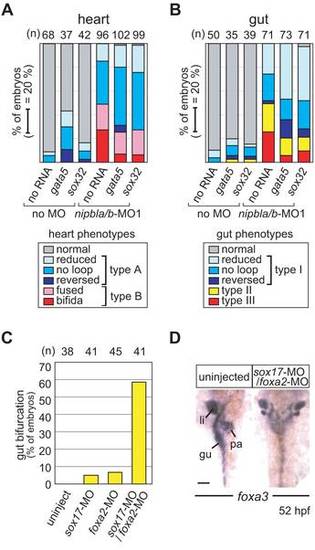
Nipbls affect gut and heart development through regulation of endodermal gene expression. (A, B) Exogenous gata5 and sox32 rescue a subset of gut and heart defects in nipbla/b-morphant embryos. mRNAs for gata5 (10 pg) or sox32 (2.5 pg) were injected into control embryos (no MO; left 3 columns) or nipbla/b-morphants (right 3 columns), and heart (A) and gut (B) morphologies were examined by ISH with cmlc2 (32 hpf) and foxa3 (52 hpf) probes, respectively. Numbers of embryos examined are shown at the top. (C, D) Gut bifurcation, similar to the type II gut phenotype found in nipbla/b-morphants, was induced by simultaneous reduction of sox17 and foxa2. (C) Frequency of gut bifurcation in sox17 and foxa2-single and double-morphants at 52 hpf. (D) Gut/visceral organ morphologies analyzed by ISH with foxa3 probe. View is dorsal, with anterior to the top. Scale bar: 50 μm. PHENOTYPE:
|
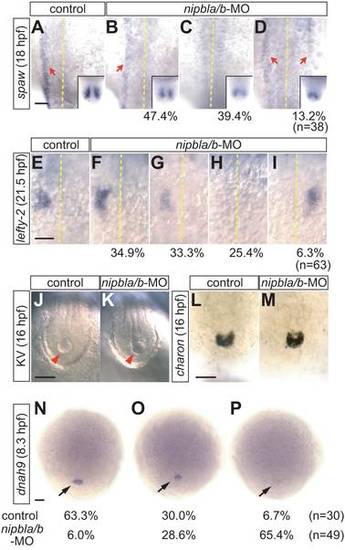
L/R patterning defects in nipbla/b-morphants. Left-sided expression of spaw (n = 38) and lefty2 (n = 60) in lateral plate mesoderm (LPM) is disrupted in nipbla/b-morphants. (A–D) At 18 hpf (18-somite), spaw expression (red arrows) was variably unchanged (B; 47.4% of embryos), absent (C; 39.4%), or bilateral (D; 13.2%). The midline is marked by a dotted line. Insets show bilateral expression of spaw in the tail-bud. (E–I) lefty2 expression at 21.5 hpf (25-somite) was either unchanged (F; 34.9%), reduced (G; 33.3%), absent (H; 25.4%) or right-sided (I; 6.3%). Views are dorsal, anterior to the top. (J–M) Morphology of Kupffer′s vesicle (J, K; arrowheads; bright-field microscopy) and charon expression (L, M; ISH; posterior views of tail regions) are similar in control and nipbla/b-morphants at 16 hpf (14-somite). (N–P) Expression of dnah9 in dorsal forerunner cells (arrows) at 8.3 hpf (80% epiboly) is reduced in nipbla/b-morphants (O, P) relative to controls. Views are dorsal, anterior to the top. Scale bars: 50 μm. EXPRESSION / LABELING:
PHENOTYPE:
|
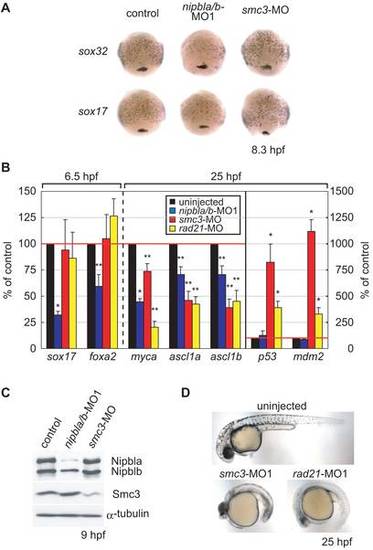
Distinct effects of Nipbl and cohesin on gene expression. (A) Expression of sox32 (upper) and sox17 (lower) in uninjected (left column), nipbla/b-morphants (middle column) and smc3-morphants (right column) was examined by in situ hybridization at 8.3 hpf (80% epiboly). Views are dorsal with anterior at top. (B) Gene expression changes in nipbla/b- and cohesin-morphants. Gene expression was examined in embryos injected with nipbla/b-MO1, smc3-MO, and rad21-MO by Q-PCR at 6.5 hpf or 26 hpf (as indicated). Expression levels are presented relative to those in uninjected embryos (100%; n = 3, * p<0.01, ** p<0.05). (C) Levels of Smc3, Nipbla, and Nibplb protein were examined by Western blotting at 9 hpf. α-Tubulin was used as a loading control. Amounts of MO injected in each embryo were: nipbla/b-MO1, 0.75 ng each; smc3-MO, 4 ng; rad21-MO, 5 ng. (D) Gross morphologies of cohesin-morphants at 25 hpf. Views are lateral with anterior to the left. EXPRESSION / LABELING:
PHENOTYPE:
|
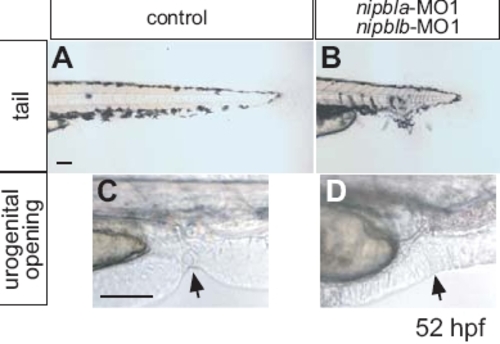
Morphological abnormalities in nipbla/b-morphants. Lateral views of tails (A, B) and anal regions (C, D) of controls and nipbla/b-morphants at 52 hpf. Morphant tails are shortened and branched along the dorsalventral axis (B). Some morphants (10%) lack a urogenital opening (arrows in C and D). Scale bars: 50 μm. PHENOTYPE:
|
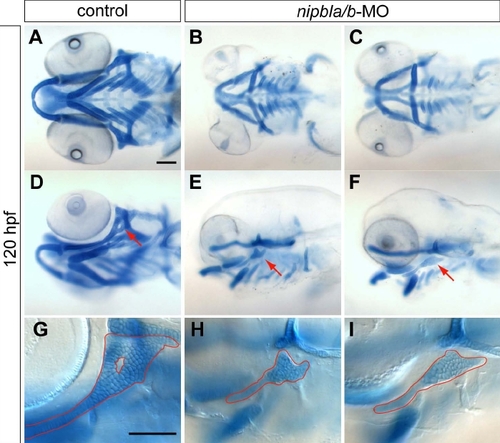
Defects in the larval craniofacial skeleton in nipbla/b-morphants. Craniofacial cartilages were stained with Alcian blue at 120 hpf. Controls (A, D, G) and two examples of nipbla/b-morphants (B, C, E, F, H, I) are shown in ventral (A–C), ventrolateral (D), and lateral view (E–I), anterior to the left. Specific reductions in hyosymplectic cartilages are indicated by arrows (D–F) and outlined at higher magnification (G–I). Scale bar: 100 μm. PHENOTYPE:
|
Effects of nipbls on heart development. Heart morphology in nipbla/b-morphants at 48 hpf was examined by the expression of cmlc2. Anterior views of control embryos (leftmost panel) as well as nipbla/bmorphants with type A or type B heart defects. White dotted lines outline the heart tubes and arrows indicate split hearts in type B morphants. Scale bar: 50 μm. |

Circulation defects and pericardial edema in the nipbla/b-morphants. (A) Numbers of embryos with heart defects in nipbla/b-MOs within each class that showed circulation defects or pericardial edema at 32 hpf. (B–E) o-Dianisidine staining of developed erythrocytes. Erythrocytes were stained by incubating anesthetized living embryos in 10 mM sodium acetate, pH 4.5, 0.65% hydrogen peroxide, 40% ethanol, and 0.6 mg/ml of o-dianisidine for 15 min at 28.5°C. Control embryos (B, C) and nipbla/b-morphants with circulation defects (D, E) were stained with o-dianisidine at 32 hpf. Ventral views of the heart (B, D) and lateral views of the tail (C, E) are shown. In morphants, erythrocytes accumulated ventrally (arrow head in E) including the intermediate cell mass (ICM) (arrow in E), and yolk surface (D). (F–I) gata1 (blood cells) (F, G; 20 hpf) and fli1a (blood vessels) (H, I; 31 hpf) expression were examined by ISH in controls (F, H) and nipbla/b-morphants (G, I). Scale bars: 100 μm. PHENOTYPE:
|
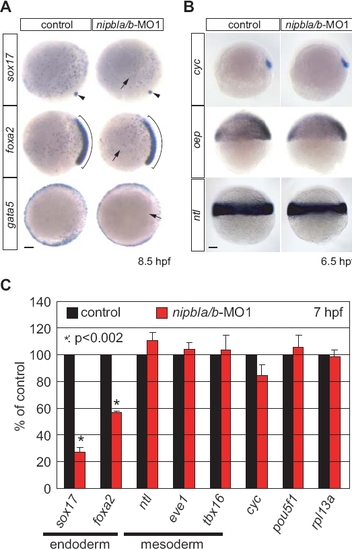
Effects of reduction of nipbls on endodermal and Nodal-signaling genes. (A) Expression of endodermal genes (sox17, foxa2, and gata5) was examined by ISH at 8.5 hpf. Expression of all three was downregulated in endoderm (arrows) but not in dorsal forerunner cells (sox17; arrowheads) or axial mesoderm (foxa2; brackets). gata5 expression was mainly reduced dorsally (arrow). (B) In contrast, no changes were observed in expression of the Nodal-related gene, cyc, a Nodal receptor co-factor, oep, or a mesodermal Nodal target, ntl, in nipbla/b-morphants compared with controls at 6.5 hpf. Lateral views with dorsal to the right in all cases except gata5, which is shown in dorsal view, anterior to the left. Scale bars: 50 μm. (C) Expression of endodermal and nonendodermal genes were examined by Q-PCR at 7 hpf in controls (black) and nipbla/b-morphants (red). Expression levels are normalized to that of ef-1a and shown relative to values in control embryos. p values were calculated by paired t test, using ΔCt values (n = 4, mean ± S.E.M., * p<0.002 and others are p>0.1). |

Effects of low amounts of smc3-MO on gene expression. (A) Morphology of living embryos at 26 hpf. Lateral views with anterior to the left. (B) Q-PCR analyses of gene expression in uninjected control (black), nipbla/b-morphants (blue), and low-smc3 (0.75 ng)-morphants (red) at 25 hpf by Q-PCR (n = 3, mean ± S.E.M.; * p<0.05 and # p>0.1 by paired t test). Scale bar: 100 μm. |

Unillustrated author statements EXPRESSION / LABELING:
|