
FIGURE
Fig. 4
- ID
- ZDB-FIG-111128-74
- Publication
- Muto et al., 2011 - Multifactorial Origins of Heart and Gut Defects in nipbl-Deficient Zebrafish, a Model of Cornelia de Lange Syndrome
- Other Figures
- All Figure Page
- Back to All Figure Page
Fig. 4
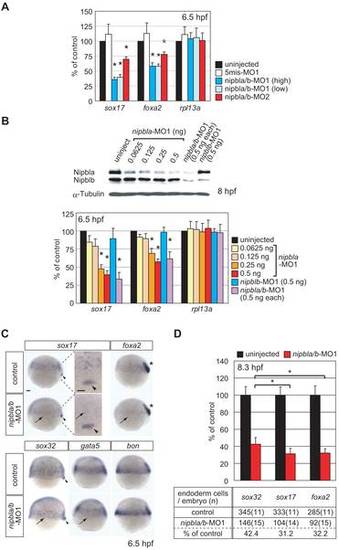
nipbls regulate the expression of endodermal genes. (A–B) Expression of sox17, foxa2, and rpl13a in nipbla/b-morphants at 6.5 hpf. mRNA levels were measured by Q-PCR, normalized to that of ef-1a, and expressed relative to values in uninjected embryos (n = 3, mean ± S.E.M.; * p<0.05 by paired t test). (A) Morpholino specificities. Uninjected embryos (black), control embryos injected with 2 ng each of 5mis-nipbla-MO1 and 5mis-nipblb-MO1 (white), and morphants co-injected with high doses (2 ng each; blue) or low doses (0.5 ng each; light blue) of nipbla-MO1 and nipblb-MO1, or with nipbla-MO2 (1.5 ng) and nipblb-MO2 (0.5 ng) (red). (B) Effects of single knockdown of Nipbla and Nipblb. Upper: protein levels of Nipbla and Nipblb at 8 hpf in morphants injected with indicated amounts of nipbla-MO1 and/or nipblb-MO1. Lower: Q-PCR analysis of sox17, foxa2, and rpl13a expression in uninjected embryos (black) and embryos injected with indicated amounts (0.0625–0.5 ng) of nipbla-MO1, with 0.5 ng of nipblb-MO1 alone, or with a mixture of 0.5 ng each of nipbla-MO1 and nipblb-MO1 (purple). (C) Analysis of endodermal gene expression by ISH. Control embryos (upper) and nipbla/b-morphants (lower) were analyzed at 6.5 hpf with sox17, foxa2, sox32, gata5, and bon Probes. Expression of all except bon was markedly (sox17, foxa2) or weakly (sox32, gata5) reduced in endoderm cells (arrows) of nipbla/b-morphants, but not in dorsal forerunner cells (sox17 and sox32; arrowheads) or axial mesoderm (foxa2; asterisks), and this is more clearly shown in higher magnification panels of sox17 expression at dorsal marginal regions. Views are lateral, with dorsal to the right, except the higher magnification panels (dorsal view, with anterior to the top.). Scale bar: 50 µm. (D) Endodermal cells, as detected by ISH with sox32, sox17, or foxa2 probes, were counted in uninjected embryos (black) and nipbla/b-morphants (red) at 8.3 hpf (80% epiboly). The bar graph expresses the data relative to average numbers in uninjected embryos (mean ± SD; * p<0.001). The table underneath presents the average numbers of endodermal cells per embryo, along with the number of embryos counted (in parentheses). |
Expression Data
| Genes: | |
|---|---|
| Fish: | |
| Knockdown Reagents: | |
| Anatomical Terms: | |
| Stage: | Shield |
Expression Detail
Antibody Labeling
Phenotype Data
| Fish: | |
|---|---|
| Knockdown Reagents: | |
| Observed In: | |
| Stage: | 75%-epiboly |
Phenotype Detail
Acknowledgments
This image is the copyrighted work of the attributed author or publisher, and
ZFIN has permission only to display this image to its users.
Additional permissions should be obtained from the applicable author or publisher of the image.
Full text @ PLoS Biol.