
- Title
-
hox13 genes are required for mesoderm formation and axis elongation during early zebrafish development
- Authors
- Ye, Z., Kimelman, D.
- Source
- Full text @ Development
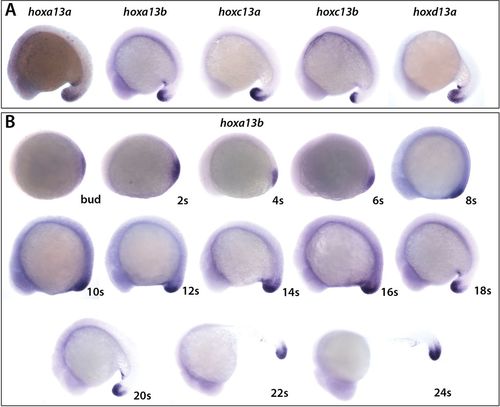
hoxa13b is expressed from early stages. (A) Expression of the five posteriorly expressed Hox13 genes at the 18-somite stage. The embryos were allowed to develop for different lengths of time to optimally show expression of each of the genes and do not reflect the relative levels of expression. (B) Expression of hoxa13b from the end of gastrulation (bud stage) until the 24-somite stage (24?s). Embryos from 8?s to 24?s were developed for the same length of time. Embryos from bud to 6?s were developed 50% longer. EXPRESSION / LABELING:
|
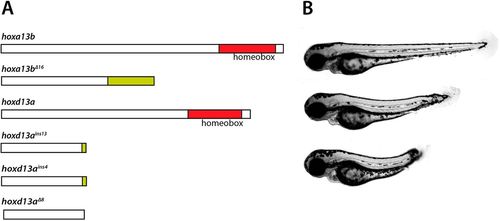
hoxa13;d13 mutants have posterior defects. (A) Scheme of Hox13 mutants. The coding regions of hoxa13b and hoxd13a are shown, with the DNA binding homeobox indicated. The hoxa13b?16 mutant is truncated due to a 16 base pair (bp) deletion that causes a frameshift, adding additional amino acids (green). Three hoxd13a mutants are shown, with insertions of 13 or 4?bp or a deletion of 8?bp. The 8?bp deletion causes an immediate truncation, whereas the insertion mutants cause frameshifts that add a small number of additional amino acids. (B) Posterior defects observed in hoxa13?16;hoxd13ains13 mutants (lower two embryos) compared with a wild-type embryo (top) at 3?dpf. PHENOTYPE:
|
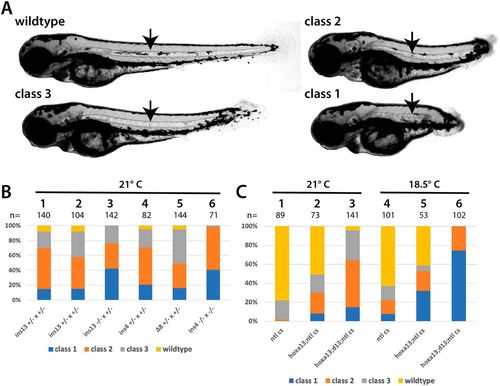
Interaction between the Hox13 genes and tbxta/ntl. (A) Classification used to score embryos at 3?dpf. The strongest class, class 1, has the same phenotype as tbxta/ntl mutants. Class 2 mutants have a clearly truncated axis, and extend beyond the anus at the end of the yolk tube. Class 3 mutants have relatively minor posterior defects. All classes of embryos have a notochord (arrow). (B) Embryos raised from different crosses that were placed at 21�C at shield stage and scored at 3?dpf. The specific hoxd13a mutation is shown; all fish were homozygous for both hoxa13b?16 and ntlcs. The embryos shown in columns 1 and 2 are from two separate families with the same genotype. (C) Embryos raised from different crosses that were placed at 21�C or 18.5�C at shield stage and scored at 3?dpf. The labels for each column refer to the adults used in the cross: ntl cs, homozygous for ntlcs; hoxa13;ntl cs, homozygous for both hoxa13b?16 and ntlcs; hoxa13;d13;ntl cs, homozygous for both hoxa13b?16 and ntlcs, and heterozygous for hoxd13ains13. PHENOTYPE:
|
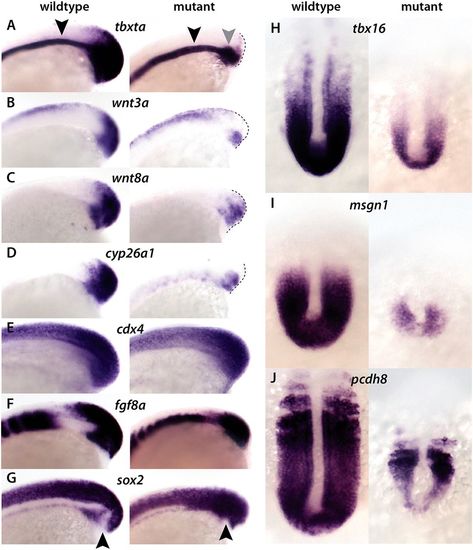
Mesodermal defects in hoxa13;ntlcs embryos maintained at 18.5�C. In situ hybridization of 15-somite wild-type and hoxa13;ntlcs embryos. (A). In mutant embryos, expression of tbxta at the posterior end (NMp domain) of the embryo is absent, whereas expression in the notochord progenitors (gray arrowhead) is retained. Note that in mutant embryos tbxta expression in the notochord is normal (black arrowheads). (B-D) Expression of wnt3a (B), wnt8a (C) and cyp26a1 (D) are strongly downregulated in the posterior of mutant embryos. (E,F) Expression of cdx4 (E) and fgf8a (F) are largely normal or only partially reduced in the posterior of mutant embryos. (G) sox2 expression expands into the mesodermal progenitor region in the mutants, whereas in wild-type embryos sox2 is absent from this region (black arrowheads). (H-J) tbx16 (H), msgn1 (I) and pcdh8 (J) are strongly downregulated in mutant embryos. A-G show side views and H-J show dorsal views. EXPRESSION / LABELING:
PHENOTYPE:
|
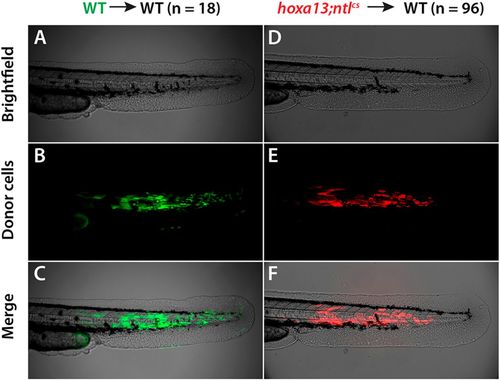
hoxa13;ntlcs cells are rescued for differentiation in a wild-type environment. Donor embryos were injected with a fluorescent dye and then 30-50 cells from each donor were transplanted into the prospective tail mesoderm of a wild-type (WT) host embryo at shield stage. At 2?dpf the embryos were imaged. (A-C) Wild-type donor cells contribute to tail muscle, producing elongated muscle cells within the somites. (D-F) Cells from hoxa13;ntlcs donors also contribute to tail muscle. |
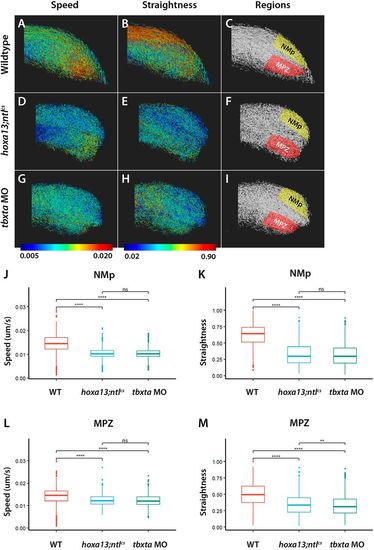
hoxa13;ntlcs mutants and tbxta morphants have similar posterior cell movements. (A-I) Embryos expressing nuclear EGFP were filmed at the posterior end. Tracks from a representative embryo are shown in each panel, with the lowest speed or straightness shown in blue and the highest in red. The regions used for quantitative analysis are shown on the right, with the NMps and mesodermal progenitor zone (MPZ) illustrated. Note the similar shapes of the tailbuds of hoxa13;ntlcs mutants and tbxta morphants (tbxta MO) compared with wild type. (J-M) Graphs of speed (J,L) and straightness (K,M) obtained from analysis of 1193, 1295 and 1396 tracks from the NMps and 1173, 1273 and 1399 tracks from the MPZ of three wild-type, hoxa13;ntlcs mutant and tbxta morphant embryos, respectively. Straightness is the displacement divided by the track length; a value of 1.0 indicates movement in a perfectly straight direction, whereas a value of 0.0 indicates no displacement from the origin. Dunn's test was used for multiple comparisons of mean speed and straightness. **P<0.01; ****P<0.001; ns, no significant difference (P>0.05). |
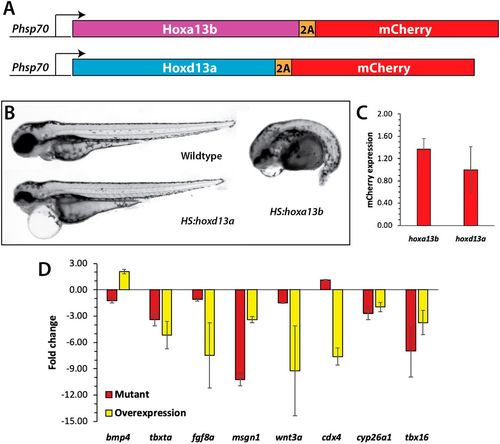
Analysis of Hox13 overexpression. (A) Constructs used to overexpress Hoxa13b and Hoxd13a. The coding region of each gene was placed under the control of a hsp70l promoter, and placed in frame with the 2A peptide and mCherry, which allows both the Hox13 protein and mCherry to be produced as one transcript and two separate proteins. (B) Wild-type and transgenic embryos were heat shocked at the 10-somite stage and then analyzed at 2?dpf. Embryos overexpressing Hoxa13b had posterior truncations, whereas embryos overexpressing Hoxd13a had normal posteriors with minor anterior defects, often including pericardial edema. We observed the same phenotype from Hoxa13b overexpression in ntl+/+, ntlcs/+ and ntlcs/cs backgrounds. (C) The levels of mCherry expression (mean�s.d.) was measured by qPCR in tailbud explants isolated from embryos heat shocked as in B. The differences in mCherry expression were not significant (Mann?Whitney test, P=0.4). (D) Fold changes in gene expression in hoxa13;ntlcs mutant embryos and embryos overexpressing Hoxa13b. Data from three independent replicates. Only bmp4 showed opposite effects in the two conditions. cdx4 in the mutant embryos was unchanged compared with the wild type. Note that the tailbud explants include the posterior notochord and neural tube; thus, the decrease in tbxta and wnt3a expression in the mutants is not as strong as shown by in situ hybridization (Fig. 4) due to their expression in these other tissues. |

Unillustrated author statements PHENOTYPE:
|