
|
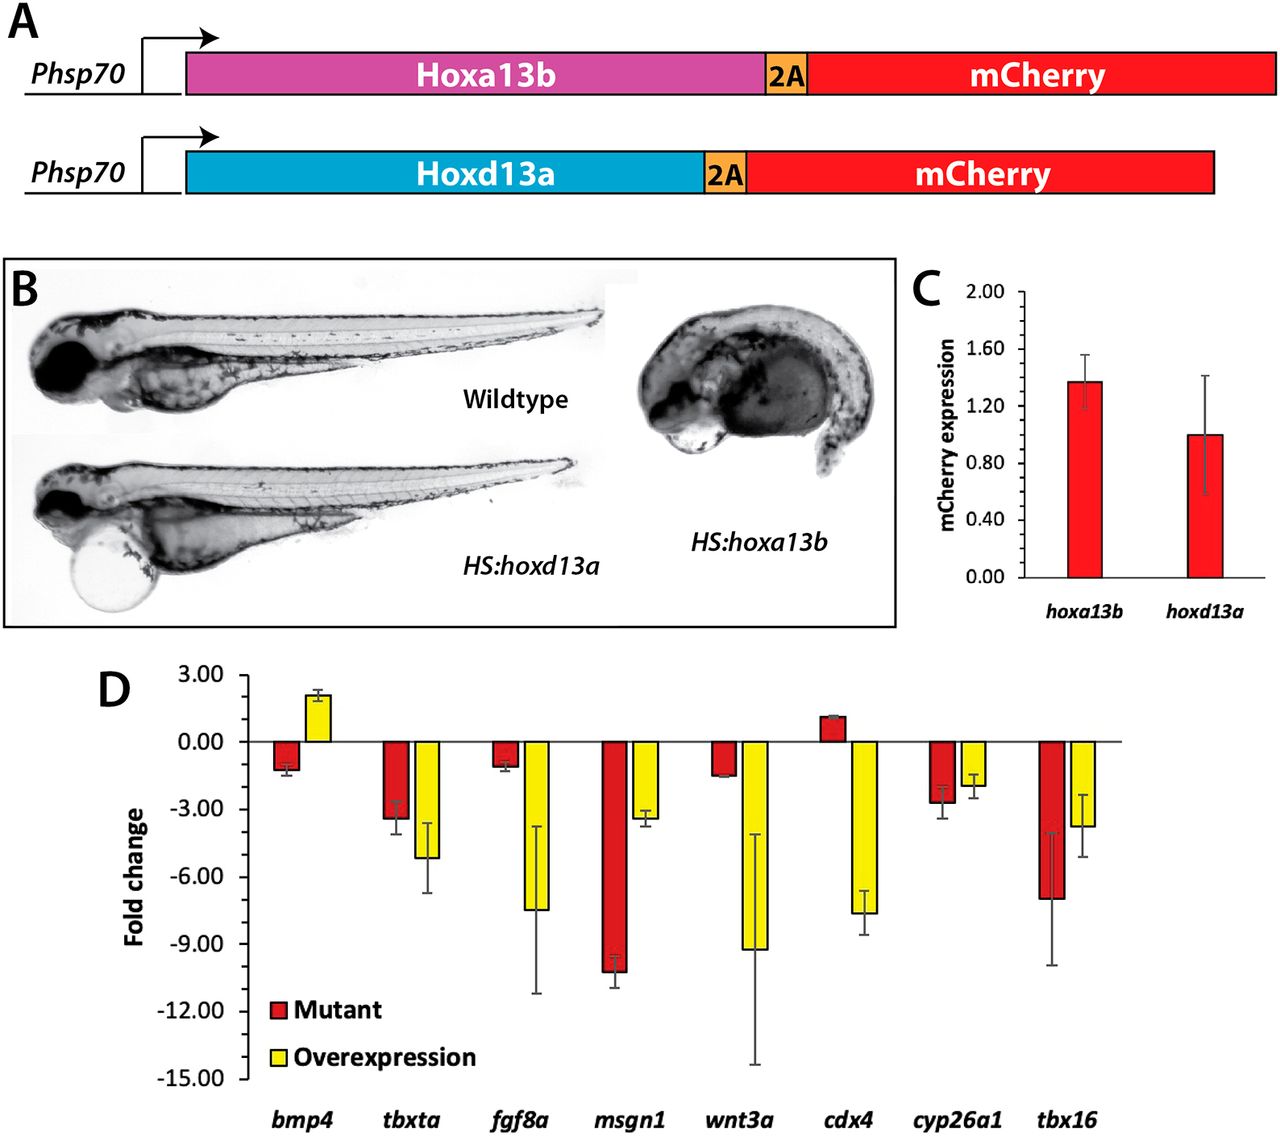
Fig. 7 Analysis of Hox13 overexpression. (A) Constructs used to overexpress Hoxa13b and Hoxd13a. The coding region of each gene was placed under the control of a hsp70l promoter, and placed in frame with the 2A peptide and mCherry, which allows both the Hox13 protein and mCherry to be produced as one transcript and two separate proteins. (B) Wild-type and transgenic embryos were heat shocked at the 10-somite stage and then analyzed at 2 dpf. Embryos overexpressing Hoxa13b had posterior truncations, whereas embryos overexpressing Hoxd13a had normal posteriors with minor anterior defects, often including pericardial edema. We observed the same phenotype from Hoxa13b overexpression in ntl+/+, ntlcs/+ and ntlcs/cs backgrounds. (C) The levels of mCherry expression (mean±s.d.) was measured by qPCR in tailbud explants isolated from embryos heat shocked as in B. The differences in mCherry expression were not significant (Mann–Whitney test, P=0.4). (D) Fold changes in gene expression in hoxa13;ntlcs mutant embryos and embryos overexpressing Hoxa13b. Data from three independent replicates. Only bmp4 showed opposite effects in the two conditions. cdx4 in the mutant embryos was unchanged compared with the wild type. Note that the tailbud explants include the posterior notochord and neural tube; thus, the decrease in tbxta and wnt3a expression in the mutants is not as strong as shown by in situ hybridization (Fig. 4) due to their expression in these other tissues.