
- Title
-
Vagus Motor Neuron Topographic Map Determined by Parallel Mechanisms of hox5 Expression and Time of Axon Initiation
- Authors
- Barsh, G.R., Isabella, A.J., Moens, C.B.
- Source
- Full text @ Curr. Biol.
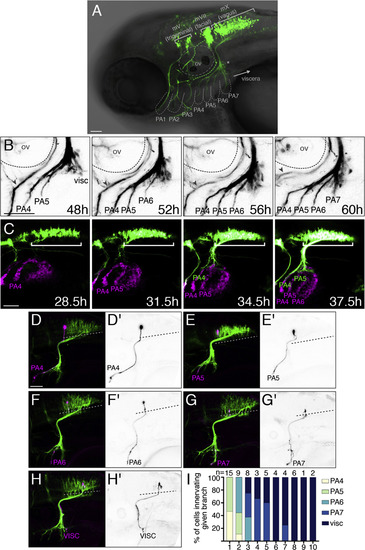
Topographic Mapping by Vagus Motor Neurons (A) Lateral view of a zebrafish embryo expressing Tg(isl1:Kaede) at 3 dpf. Brackets, cranial motor nuclei; ov, otic vesicle; PA, pharyngeal arches. Asterisk marks a subset of vagus sensory cells labeled by islet1. (B) mX axon branches innervate PAs sequentially. See Movie S1. Gray arrowhead indicates the glossopharyngeal motor nerve (mIX). (C) tcf21:mCherry+ PA muscle precursors (magenta) appear sequentially prior to mX axon entry. White bracket indicates mX nucleus expressing isl1:eGFPCAAX (green). See Movie S2. (D?H) mX neurons are arranged in a topographic map. Single neuron labeled by Tg(isl1:eGFPCAAX) in magenta or black (D??H?) on Tg(isl1:mRFP) background (green). Dotted lines indicate the length of the mX territory. (D) Neuron in region 1 projecting to PA4; (E) neuron in region 2 projecting to PA5; (F) neuron in region 2 projecting to PA6; (G) neuron in region 3 projecting to PA7; (H) neuron in region 6 projecting to the visceral branch. (I) Quantification of (D)?(H). mX territory was divided into 10 equal-length bins along the A-P axis. In all figures, anterior is left and dorsal is up. The scale bars represent 50 ?m. See also Figure S1. EXPRESSION / LABELING:
|
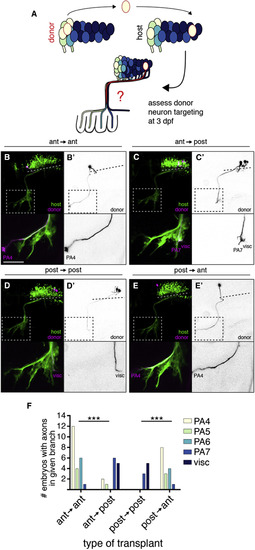
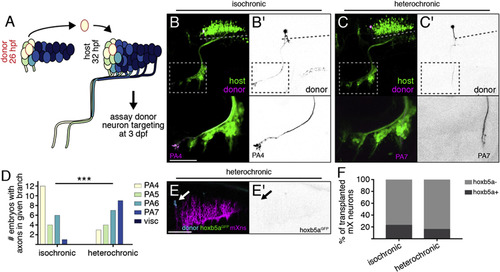
Vagus Motor Neuron Position Determines Axon Target (A) Schematic of postmitotic neuron transplantation approach. mX neurons are transplanted homotopically or heterotopically (pictured) before axon formation, and donor axon targeting is assayed at 3 dpf. (B?E) Examples of homotopic (B and D) and heterotopic (C and E) transplants. Donor-derived neurons are marked by Tg(isl1:Kaede) in magenta and black on white (B??E?). Host motor neurons are marked by Tg(isl1:GFP) in green. Dotted lines indicate length of mX territory; dotted boxes indicate region shown in lower panels. (F) Quantification of transplant results showing number of host embryos with a donor axon in a given branch. Statistical analysis was done with Fisher?s exact test (see STAR Methods for details). Ant ? ant: n = 14 host embryos; ant ? post: n = 12; post ? post: n = 7; post ? ant: n = 12. |
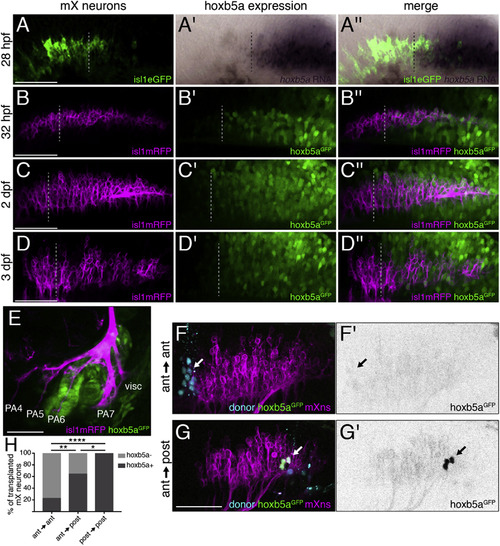
hox5 Expression Distinguishes Anterior and Posterior mX Neurons (A) hoxb5a is expressed in the posterior mX territory. RNA in situ hybridization of 28 hpf embryo for hoxb5a expression (purple) followed by immunostaining against Tg(isl1:eGFPCAAX) to label motor neurons (green) is shown. Dotted lines in (A)?(D) indicate anterior limit of hoxb5a expression. See also Figure S2. (B?E) hoxb5aGFP is expressed in posterior mX neurons, PA6, and PA7. hoxb5aGFP (green) and Tg(isl1:mRFP) (magenta) at 32 hpf (B), 2 dpf (C), or 3 dpf (D and E) are shown. (F and G) Anterior mX neurons marked by lineage dye (cyan) and isl1:mRFP (magenta) transplanted homotopically (F) or heterotopically (G) are hoxb5aGFP-negative (arrow in F) or hoxb5aGFP-positive, respectively (arrow, green in G and black in G?). Host motor neurons express Tg(isl1:mRFP) (magenta). (H) Quantification of (F) and (G). Analysis was done by Fisher?s exact test. Ant ? ant: n = 22 neurons, 6 embryos; ant ? post: n = 28 neurons, 9 embryos; post ? post: n = 13 neurons, 5 embryos. EXPRESSION / LABELING:
|

hox5 Expression Directs mX Axons to Posterior Targets (A?D) Expression of control isl1:eGFPCAAX (A) or isl1:hox5-P2A-eGFPCAAX expression construct (B?D, magenta; A??D?, black) in a Tg(isl1:mRFP) background (green). Dotted lines indicate length of mX territory; dotted boxes indicate region shown in bottom panels. (E) Quantification of distribution of labeled neurons after hox5 expression as in (A)?(D). Regions are based on morphological boundaries as in Figure S1. (F) Quantification of labeled axon targeting in (A)?(D). Analysis was done using Fisher?s exact test comparing control to each ectopic expression condition with respect to each axon branch. Conditions are considered different if they differ in at least one branch. In both (E) and (F), control n = 17 embryos, hoxa5a n = 24, hoxb5a n = 20, and hoxb5b n = 28. (G) Analysis of axon targeting in cases where a labeled mX neuron was located within the most anterior region of the mX territory (bin 1; see Figure 1I). Ectopic hoxb5a-expressing mX neurons in bin 1 avoid PA4 and PA5. Analysis was done by Chi-square followed by Fisher?s exact test comparing each hox5 construct to control. Control n = 9 embryos, hoxa5a n = 17, hoxb5a n = 11 embryos, and hoxb5b n = 16. |
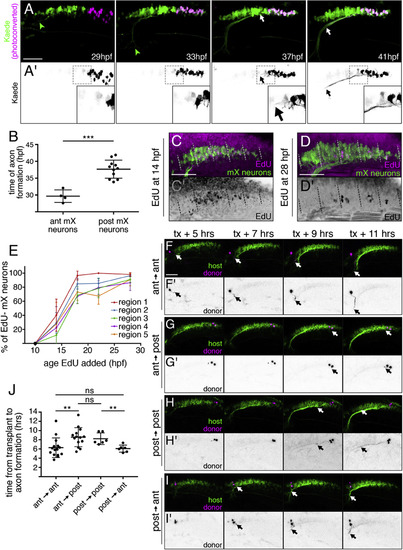
Time of Axon Formation and Arrival in the Head Periphery Is Delayed in Posterior mX Neurons Independent of Birthdate (A) Stills from representative time lapse (see Movie S3) of embryo expressing Tg(isl1:Gal4);Tg(UAS:Kaede). Photoconverted posterior mX neurons (magenta, A; black, A?; white arrow) initiate axons 8 hr after anterior mX neurons (green, green arrowhead). (B) Quantification of (A). Each point represents a single embryo. Analysis was done by unpaired t test. (C and D) Embryo expressing Tg(isl1:GFP) (green) was incubated in EdU (magenta; C? and D?, black) to label cells born after 14 hpf (C) or 28 hpf (D). Embryos were fixed at 48 hpf, and the mX territory was divided into 5 equal-length regions from anterior (1) to posterior (5). (E) Quantification of (C and D) showing percentage of postmitotic (EdU?) mX neurons (isl1:GFP+) in each region at each time point ([no. EdU?GFP+ cells]/[no. GFP+ cells]). Each point represents mean; error bars show SD. n = 5 embryos for all time points except 14 hpf, where n = 4 embryos. (F?I) Transplanting an anterior mX neuron heterotopically into the posterior delays axon formation (F and G) whereas transplanting a posterior mX neuron into the anterior hastens axon formation (H and I). Donor neurons are marked by Tg(isl1:Kaede) in magenta and (F??I?) black, and host neurons are marked by Tg(isl1:mRFP) in green. See also Movies S4 and S5. (J) Quantification of (F)?(I). Each point represents a single embryo. Analysis was done by unpaired t test. |
Time of mX Axon Outgrowth Determines Peripheral Target Independently of hox5 Expression (A) mX neurons are transplanted from anterior to anterior (homotopic) from a 26 hpf donor to a 32 hpf host, and donor axon targeting is assayed at 3 dpf. (B and C) Anterior mX neurons transplanted isochronically (B) innervate anterior targets whereas anterior mX neurons transplanted heterochronically (C) innervate posterior targets. Donor neurons are marked by Tg(isl1:Kaede) (magenta; B? and C?, black). Host motor neurons are marked by Tg(isl1:GFP) (green). Dotted lines indicate length of mX territory. Dotted boxes indicate region shown in bottom panels. (D) Quantification of transplant results. Isochronic control transplants are the same data shown in Figure 2F (anterior ? anterior). Analysis was done using Fisher?s exact test; see STAR Methods for details. Isochronic: n = 14 host embryos; heterochronic: n = 16. (E) Change in targeting after heterochronic transplantation is not due to induction of hox5 expression. Transgenes are as described in Figures 3F and 3G. (F) Quantification of (E). Isochronic control transplants are the same data shown in Figure 3F. Heterochronic: n = 19 cells, 11 embryos. |
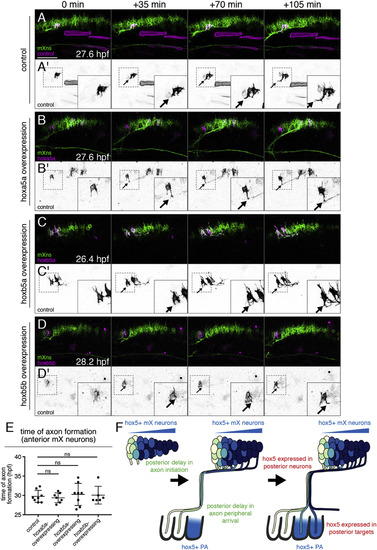
hox5 Acts Independently of Time of Axon Formation (A?D) hox5 expression does not delay the time of axon formation in anterior mX neurons. Stills from representative time lapses of control (A) or ectopic hox5-expressing (B?D) mX neurons (magenta or black in A??D?) in a Tg(isl1:mRFP) background (green) are shown. Arrows indicate the emerging axon. See Movies S6, S7, S8, and S9. (E) Quantification of (A)?(D). Each point represents a single embryo. Analysis was done by unpaired t test. (F) Model of dual mechanisms governing mX neuron topographic map development. Anterior mX neurons arrive in the head periphery when only anterior PAs are available for innervation. Delayed axon initiation in posterior mX neurons results in delayed arrival in the periphery when posterior PAs have formed. Additionally, hox5 genes are expressed in posterior mX neurons and bias their axons toward posterior, hox5-expressing PAs. |

Topographic mapping by vagus motor neurons. Related to Figure 1. (A-C) Photoconverted Kaede in a single one of the mX axon branches at 4 dpf is shown in magenta and (A?-C?) black. Dotted lines mark the length of the mX territory. PA4-innervating neurons are at the anterior edge of the mX territory, PA7-innverating neurons are posterior to PA4 neurons, and viscera-innervating neurons are at the posterior-most end of the mX territory. Unfortunately, due to the small scale of the region, we were not able to photoconvert PA5 or PA6 alone. (D) Quantification of axon photoconversion experiments. Each bar represents a single embryo. Analysis done using unpaired t test comparing anterior and posterior borders of photoconverted population. (E-J) Photoconverted Kaede in cell bodies is shown in magenta and (E?-J?) black with anterior left and dorsal up. Bottom panels show photoconverted Kaede in peripheral axon branches. (E,E?) The anterior-most 20 um of the mX territory was photoconverted. (F-J,F?-J?) 5 regions were defined using somite boundaries, with the anterior border of region 1 aligning with the anterior border of somite 1, and the posterior border of region 5 extending halfway into somite 2. Cells in a single region were photoconverted. (K) Quantification of (E-J). n = 10 embryos per region photoconverted. Analysis was done using Chi-square test comparing regions in pairwise combinations with respect to each axon branch. Regions are considered different if they differ in at least one branch. Anterior left and dorsal up, scale bars 50 um. |

Expression of hox genes in rhombomere 8. Related to Figure 3. (A-L) RNA in situ hybridization at 27 hpf showing hox gene expression in purple. Brackets indicate mX territory. hoxa5a, hoxb5a, and hoxb5b are all expressed in posterior but not anterior r8. Dorsal view with anterior left, scale bars 50 um. |