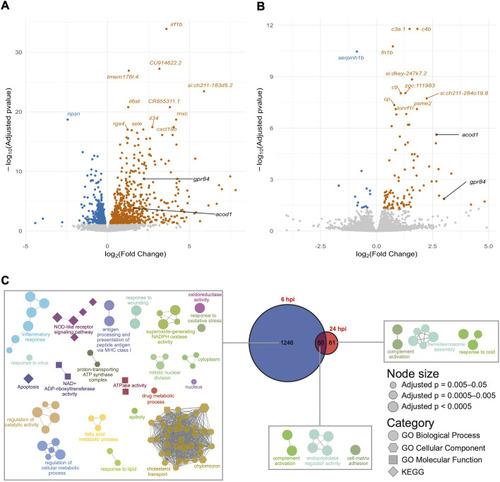
Analysis of differentially expressed genes in S. flexneri-injected embryos. (A,B) Volcano plots of differentially expressed genes between embryos infected with S. flexneri and mock-injected at 6 hpi (A) and 24 hpi (B). Each point represents a gene, -log10(adjusted P value) is plotted on the y-axis and log2(fold change) on the x-axis. Upregulated genes are coloured in orange and downregulated genes in blue. Genes with the highest -log10(adjusted P value) are labelled. gpr84 and acod1 are highlighted in black as these genes were further pursued for functional characterisation for a role in susceptibility to infection. (C) Gene ontology (GO) term enrichments. Network diagrams of GO term enrichments for genes differentially expressed at 6 hpi only (left), 24 hpi only (right) and both 6 and 24 hpi (middle). Each node in the diagrams represents an enriched GO term, and terms are connected to terms that share annotated genes. This clusters the terms into process-related groups. The Venn diagram shows the numbers of differentially expressed genes at each timepoint and the overlap.
|
