|
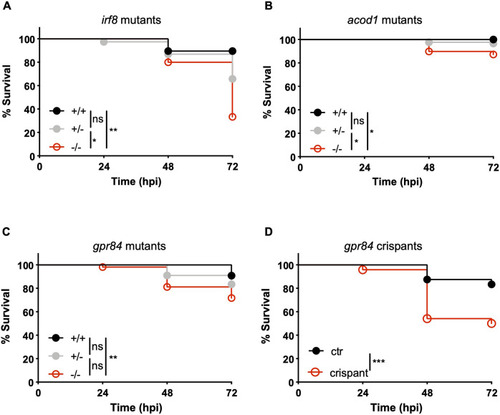
Functional analysis of zebrafish mutants with susceptibility to infection. (A-D) Survival curves of larvae derived from incrosses of irf8 (A), acod1 (B) or gpr84 (C) heterozygous carriers of null mutations, and survival curves of gpr84 crispant larvae or controls (D). Injections were performed in 2-day post-fertilisation larvae via the hindbrain ventricle with 5000-10,000 CFU of S. flexneri. For A-C, all larvae were individually genotyped post-mortem or at the end of the experiment. For D, a few randomised larvae were individually genotyped to confirm efficient CRISPR targeting. *P<0.05, **P<0.01; ***P<0.001 [Log-rank (Mantel-Cox) test]. A total of 72 (A, 19 homozygote wild types; 38 heterozygotes; 15 homozygote mutants), 172 (B, 46 homozygote wild-types; 87 heterozygotes; 39 homozygote mutants), 262 (C, 76 homozygote wild-types; 133 heterozygotes; 53 homozygote mutants) or 96 (D, 48 crispants and 48 controls) larvae were used for the survival analyses.
|