|
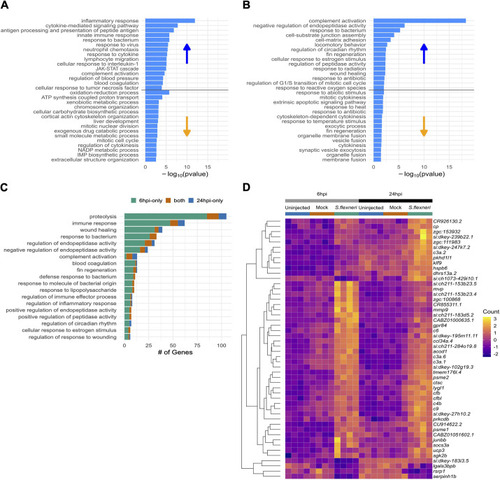
Gene ontology enrichment analysis of S. flexneri-injected embryos. (A,B) Histogram chart of the top 15 GO terms enriched by either up- or downregulated genes. (A) 6 hpi. (B) 24 hpi. Bars represent -log10(P value) for the enrichment. Each plot is divided into enrichments caused by upregulated genes (top half) and caused by downregulated genes (bottom half). (C) Bar chart of numbers of genes driving the enrichment of GO terms that are shared between the timepoints. Genes differentially expressed at 6 hpi only are shown in green, those expressed at 24 hpi only are in blue and those expressed at both timepoints are in orange. (D) Heatmap of expression of the 50 genes that are differentially expressed at both 6 and 24 hpi in S. flexneri versus uninjected and mock-injected embryos. The colour scale represents normalised counts calculated by DESeq2 that have been mean-centred and scaled by standard deviation for each gene across all the samples.
|