FIGURE SUMMARY
Title

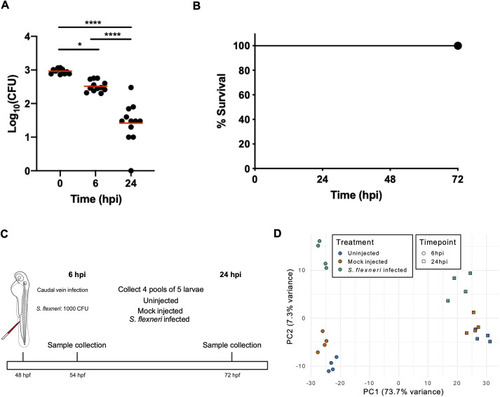
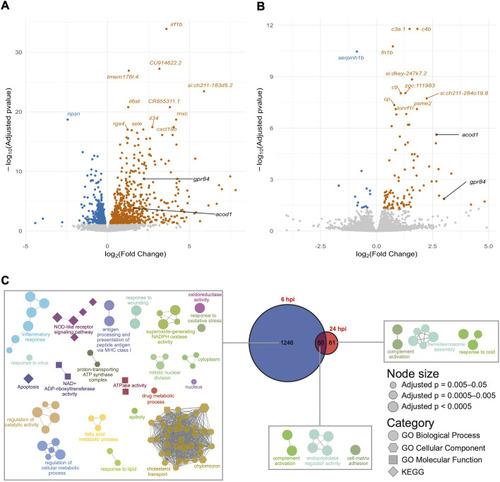
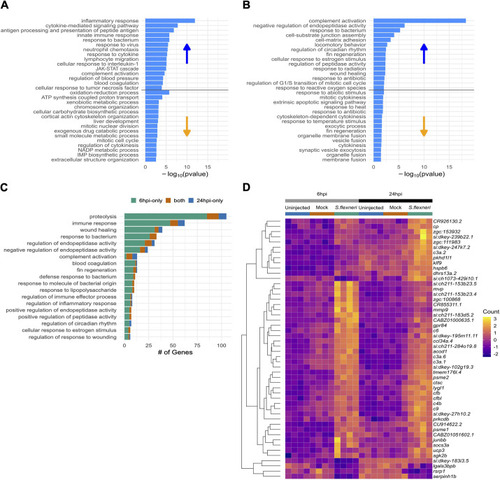
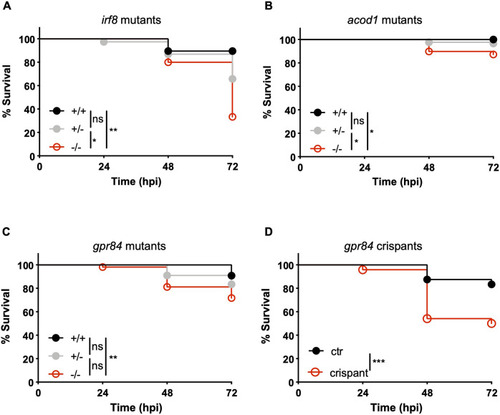
Transcriptional profiling of zebrafish identifies host factors controlling susceptibility to Shigella flexneri

Authors
Torraca, V., White, R.J., Sealy, I.M., Mazon-Moya, M., Duggan, G., Willis, A., Busch-Nentwich, E.M., Mostowy, S.
Source
Full text @ Dis. Model. Mech.

Experimental design of Shigella-zebrafish infection and transcriptomic data collection. (A,B) Log10-transformed CFU counts (A) and survival curves (B) of larvae injected via the caudal vein with 1000 CFU of S. flexneri. Injections were performed in 2-day post-fertilisation larvae. *P<0.05; ****P<0.0001 (one-way ANOVA with Tukey's multiple comparisons test). A total of 36 larvae (12 per timepoint) were sacrificed to determine the bacterial load (A), whereas a total of 63 larvae were used for the survival analysis (B). (C) Workflow of the RNA sequencing experiment. Four pools of five embryos injected with 1000 CFU of S. flexneri (or mock-injected control) at 24 h post-fertilisation (hpf) were collected at 6 and 24 h post-infection (hpi) for RNA sequencing. Uninfected embryos were also collected at the same timepoints. (D) Principal component analysis (PCA). Regularised log-transformed counts for the 2500 most variable genes across the samples were used in PCA. The first two components are plotted. PC1 separates the samples by timepoint (circle, 6 hpi; square, 24 hpi) and PC2 reflects infection status (blue, uninfected; orange, mock infected; green, S. flexneri infected).

Analysis of differentially expressed genes in S. flexneri-injected embryos. (A,B) Volcano plots of differentially expressed genes between embryos infected with S. flexneri and mock-injected at 6 hpi (A) and 24 hpi (B). Each point represents a gene, -log10(adjusted P value) is plotted on the y-axis and log2(fold change) on the x-axis. Upregulated genes are coloured in orange and downregulated genes in blue. Genes with the highest -log10(adjusted P value) are labelled. gpr84 and acod1 are highlighted in black as these genes were further pursued for functional characterisation for a role in susceptibility to infection. (C) Gene ontology (GO) term enrichments. Network diagrams of GO term enrichments for genes differentially expressed at 6 hpi only (left), 24 hpi only (right) and both 6 and 24 hpi (middle). Each node in the diagrams represents an enriched GO term, and terms are connected to terms that share annotated genes. This clusters the terms into process-related groups. The Venn diagram shows the numbers of differentially expressed genes at each timepoint and the overlap.

Gene ontology enrichment analysis of S. flexneri-injected embryos. (A,B) Histogram chart of the top 15 GO terms enriched by either up- or downregulated genes. (A) 6 hpi. (B) 24 hpi. Bars represent -log10(P value) for the enrichment. Each plot is divided into enrichments caused by upregulated genes (top half) and caused by downregulated genes (bottom half). (C) Bar chart of numbers of genes driving the enrichment of GO terms that are shared between the timepoints. Genes differentially expressed at 6 hpi only are shown in green, those expressed at 24 hpi only are in blue and those expressed at both timepoints are in orange. (D) Heatmap of expression of the 50 genes that are differentially expressed at both 6 and 24 hpi in S. flexneri versus uninjected and mock-injected embryos. The colour scale represents normalised counts calculated by DESeq2 that have been mean-centred and scaled by standard deviation for each gene across all the samples.

Functional analysis of zebrafish mutants with susceptibility to infection. (A-D) Survival curves of larvae derived from incrosses of irf8 (A), acod1 (B) or gpr84 (C) heterozygous carriers of null mutations, and survival curves of gpr84 crispant larvae or controls (D). Injections were performed in 2-day post-fertilisation larvae via the hindbrain ventricle with 5000-10,000 CFU of S. flexneri. For A-C, all larvae were individually genotyped post-mortem or at the end of the experiment. For D, a few randomised larvae were individually genotyped to confirm efficient CRISPR targeting. *P<0.05, **P<0.01; ***P<0.001 [Log-rank (Mantel-Cox) test]. A total of 72 (A, 19 homozygote wild types; 38 heterozygotes; 15 homozygote mutants), 172 (B, 46 homozygote wild-types; 87 heterozygotes; 39 homozygote mutants), 262 (C, 76 homozygote wild-types; 133 heterozygotes; 53 homozygote mutants) or 96 (D, 48 crispants and 48 controls) larvae were used for the survival analyses.

Acknowledgments
This image is the copyrighted work of the attributed author or publisher, and ZFIN has permission only to display this image to its users. Additional permissions should be obtained from the applicable author or publisher of the image. Full text @ Dis. Model. Mech.