FIGURE SUMMARY
Title

Transcriptome remodelling and changes in growth and cardiometabolic phenotype result following Grb10a knockdown in the early life of the zebrafish

Authors
Evans, B.L., Garner, T., De Leonibus, C., Wright, L., Sharps, M., Wearing, O.H., Ripley, D.M., Shiels, H.A., Hurlstone, A.F.L., Clayton, P.E., Stevens, A.
Source
Full text @ Cell. Mol. Life Sci.

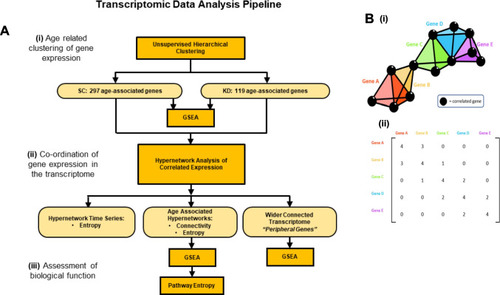
Pipeline of transcriptomic analysis and hypergraphs. (A) Analysis pipeline of transcriptomic data. (i) Unsupervised hierarchical clustering was performed to identify age-associated gene clusters. Genes were filtered by variance, using a projection score to maximise the informativeness of the genes selected. Clusters of age-associated genes were identified for SC and KD animals. (ii) hypergraphs were generated using age associated genes for each group. hypergraph structure was quantified using connectivity and entropy. Clusters of highly connected genes were identified, and a wider set of transcripts were implicated as important by identifying the complete subgraph between cluster nodes and edges in the hypergraph incidence matrix. (iii) Biological function was assessed in two ways. GSEA was performed using genes clustered by the hypergraph or implicated by the complete subgraph in the hypergraph incidence matrix. Secondly, biological processes identified by GSEA were assessed for functional activity using hypergraphs. Hypergraphs were iterated, using subsets of genes associated with each process, and hypergraph entropy was calculated. A Bayesian modelling approach was used to detect differences in entropy distributions between processes. (B) (i). A general model of a hypergraph, shown as a three-dimensional representation of genes (coloured tetrahedra) correlating with the expression of other genes (black spheres). Shared correlations are represented by matching vertices, edges, and faces of the tetrahedra. The dimensionality of the connection between genes is defined by the number of shared correlations between those genes. (ii). A hypergraph representation of the “higher order” interactions within the transcriptome. This summary of the correlations shared between genes can be considered as the incidence matrix of a multi-dimensional network

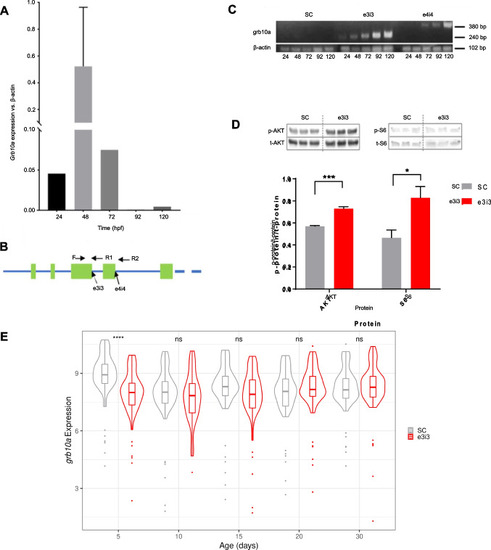
Grb10a is successfully knocked down in zebrafish injected with splice-blocking antisense oligonucleotides. (A) Grb10a qPCR of WT embryos (24–120 hpf, triplicated, n = 5 embryos per well). Data are shown as gene expression relative to β-actin with maximum levels at 48 hpf. (B) Schematic of the first five exons of the zebrafish grb10a gene. 5’ splice sites are highlighted with the forward and reverse primer triad indicated. (C) Multiplexed PCR amplification of the e3i3 and e4i4 splice site in embryos treated with either Standard Control (SC) morpholino, e3i3, or e4i4. β-actin was used as a positive control. (D) Western blot results of phosphorylated versus total protein ratios for two major signalling molecules of the insulin signalling pathway: AKT and S6. Quantitation using densitometry depicts mean + SEM. Activation of both proteins was found to be significantly elevated in KD zebrafish compared to SC (n = 3, unpaired t-test *** p = 0.0007, * p = 0.04). (E). Expression of grb10 mRNA throughout early life. Grb10 expression is decreased at 5 dpf in the KD but thereafter levels in the KD are not different from those in the SC (Wilcoxon rank sum test. **** p = 0.00003)

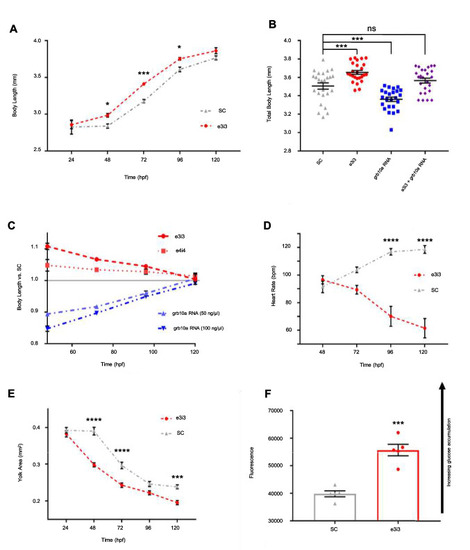
Growth and cardiometabolic phenotype are significantly impacted by early life grb10a knockdown. (A) Mean total body length ± SEM of SC and KD zebrafish from 24 to 120 hpf (multiple comparison 2-way ANOVA, * p < 0.05, *** p = 0.0003). (B) Mean total body length ± SEM and individual data points of 96 hpf zebrafish embryos (n = 25). Grb10a KD phenotype was reversed in grb10a overexpression zebrafish. Co-injection resulted in phenotype rescue. One-way ANOVA revealed KD zebrafish were significantly longer, while grb10a overexpression zebrafish were significantly smaller than SC (*** p = 0.0001). Rescue zebrafish were of similar length to SC (p = 0.38). (C) Mean body length measurements of the KD relative to SC ± SEM from 48 to 120hpf. (D) Mean heart rate ± SEM in beats per minute of SC and KD zebrafish (multiple comparison 2-way ANOVA, **** p < 0.0001). (E) Mean yolk area ± SEM of SC and KD embryos over the embryonic life stage (multiple comparisons 2-way ANOVA, *** p = 0.0004. (F) Glucose Uptake-Glo.™ Assay of 96 hpf KD and SC zebrafish, where higher luminescence indicates a greater accumulation of intracellular 2D6P. Luminescence was approximately 30% greater in KD zebrafish compared to SC (unpaired t-test, *** p = 0.0002)

Transcriptomic analysis of standard control and grb10a knockdown gene expression over the first 30 dpf. Hierarchically clustered heat maps of gene expression generated from an Affymetrix GeneChip™ Zebrafish Genome Array of SC and KD zebrafish RNA, taken at 5, 10, 15, 20, and 30 dpf. (A) Expression of age-related genes in SC segregates into three clusters in SC zebrafish. (B) Clustering of the same age-related genes (identified in A) is disrupted in KD. Notably, the cluster of genes expressed at 5 dpf in SC are expressed at a variety of time points in KD. (C) Analysing the KD dataset independently highlights a set of genes with age related gene expression which fall into two clusters. (D). Venn diagram of age associated genes identified separately in SC and KD demonstrates that only a small proportion of SC age associated genes (30%, 90/297) remained age associated in KD. (E) Gene set enrichment analysis, using the GO Biological Process Ontology gene list, of the age related genes in the SC and KD datasets. The top 20 most enriched pathways with differential expression are included here, with associated normalised enrichment scores and q-values

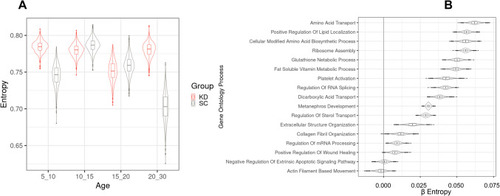
Hypergraph entropy in the transcriptome reveals differences over time and between functions. (A) hypergraphs were iterated using randomly selected genes and a moving window approach to assess change in transcriptomic entropy over time. SC and KD are significantly different at all time points (FDR < 2.4 × 10–11 ANOVA with Tukey post-hoc) though the largest differences exist at 5–10 dpf (fold change = 0.052) and 20–30 dpf (0.11). (B) hypergraphs were iteratively generated from genes attributed to each pathway and entropy was modelled across the two treatment groups. β values represent the difference in entropy between SC and KD, with a β value of 0 indicating no difference between groups. Positive β values represent higher entropy in SC compared to KD. Ontology classes are considered to be significantly different if the 89% CI of β values does not include 0. Actin filament-based movement and negative regulation of extrinsic apoptotic signalling pathway were the only two pathways with no difference identified between the groups

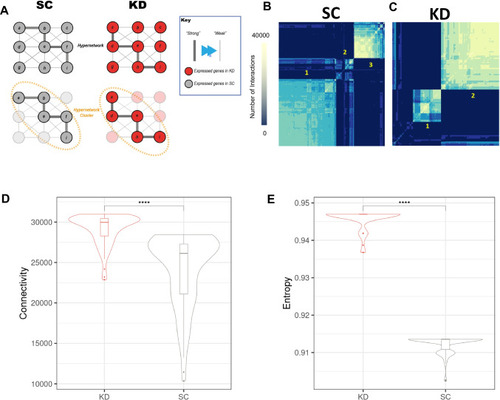
The coordination of age associated genes is altered by grb10a KD, as assessed by hypergraph analysis (A) hypergraphs form clusters of genes with higher order interactions between them; this allows us to refine groups of causally associated elements from a broader set of targets. (B) hypergraph analysis of the identified age-associated genes formed three such clusters of genes in SC zebrafish, corresponding to [1] 5 dpf, [2] 10–15 dpf, and [3] 20–30 dpf. (C) Two clusters were defined in the KD data, corresponding to [1] 5–15 dpf and [2] 20–30 dpf. (D) and (E) Violin plots of connectivity (left) and entropy (right) in the 20–30 dpf cluster. The KD transcriptome was more connected with higher entropy compared to SC, suggesting a more diverse set of connections are made by age associated genes (Wilcoxon Rank sum **** p < 0.0001)

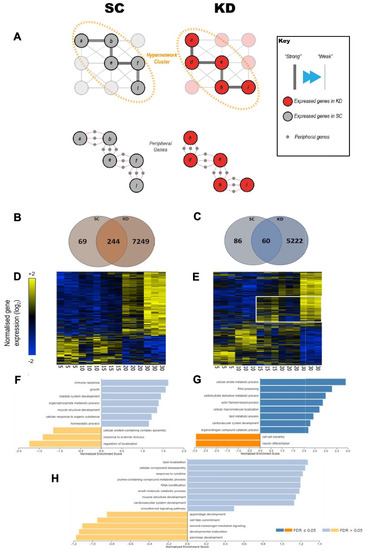
Analysis of the set of genes in the wider transcriptome shows a 27.8-fold increase in the KD ZF. (A) Identification of peripheral elements underpinning the hypergraph implicates a wider set of genes than the initial targets. A summary of those peripheral elements is presented here. (B, C) Venn diagrams of genes positively (B) and negatively (C) correlating with age. (D, E) Hierarchically clustered heat maps of gene expression of the genes identified in the wider transcriptome. Gene expression in the standard control (D) cluster into two age related groups, whereas expression in the knockdown (E) show significant dysregulation. (F, G) Gene set enrichment analysis (GSEA) ranked by R-value of rank age regression in the standard control (F) and knockdown (G). (H) GSEA ranked by R-value of rank age regression of the cluster of genes in the white box in (E)

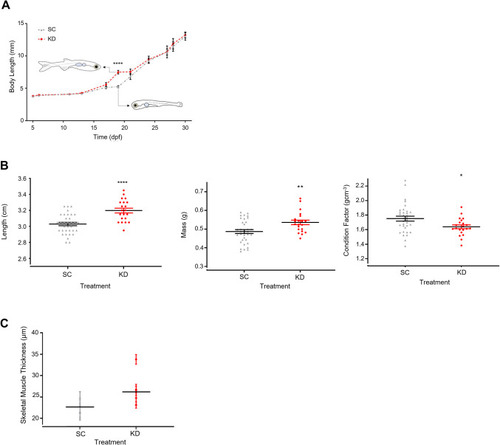
Growth in juvenile Zebrafish and adult size and skeletal muscle thickness at 18 months. (A) Mean total body length of SC and KD zebrafish up to 30 dpf. Following the embryonic growth spurt, KD zebrafish experienced an additional period of rapid growth between 15 and 20 dpf (unpaired t-test, **** p < 0.0001). Typical morphology for body length at 18 dpf is included for reference. (B) Individual total body length (left panel), mass (middle panel), and condition factor scores (right panel) for 18-month KD and SC zebrafish (n = 21–24). Length and mass were significantly higher in the KD (unpaired t-test, **** p < 0.0001, ** p = 0.005), while condition factor was significantly lower (* p = 0.02), indicating KD zebrafish have leaner bodies. (C) Thickness of 10 skeletal muscle fibres per fish (n = 5) stained with Masson’s Trichrome. Fibre thickness was marginally higher in KD compared to SC zebrafish (repeated measure ANOVA, p = 0.06). Data are presented as overall group mean and as mean ± SEM for each fish

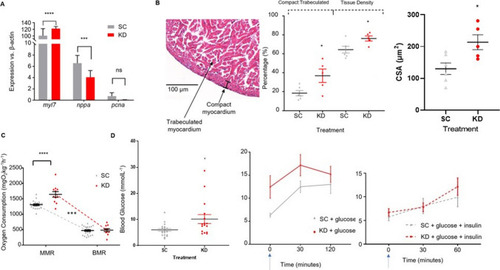
Cardiac gene expression and Cardiometabolic function in 18-month-old adult Zebrafish. (A) qPCR results of three genes associated with cardiac performance in adult cardiac tissue, relative to β-actin. Myl7 expression was significantly elevated in KD zebrafish (unpaired t-test, **** p < 0.0001) while nppa expression was significantly down regulated (*** p = 0.001) compared to SC zebrafish. There was no significant difference between the expression of pcna (p = 0.3). (B) Ventricular morphometrics obtained by Masson’s Trichrome histology comparing KD and SC compacta thickness, tissue density, and fiber cross sectional area. The compacta layer was significantly thicker (unpaired t-test, * p = 0.03) and overall tissue density was higher (* p = 0.03) in the KD zebrafish, and the fiber cross-sectional area (CSA) was increased (* p = 0.02) (n = 5–6). (C) Maximum (MMR) and Basal (BMR) oxygen uptake rate of adult (18 month) zebrafish, adjusted for body mass. BMR was comparable between the two groups (unpaired t-test, NS), while MMR was greater in the KD zebrafish (**** p < 0.0001), resulting in a greater aerobic scope (dotted line, unpaired t-test, *** p = 0.0007). (D) Fasting Glucose concentrations (left panel), glucose tolerance testing (centre panel) and insulin sensitivity testing (right panel) in adult (18 month) KD and SC zebrafish. Fasting glucose was higher in the KD (n = 16) than in the SC (n = 21) (unpaired t-test, p = 0.01). There were marginally higher glucose concentrations in the KD zebrafish in the glucose tolerance test (repeated measures ANOVA, p = 0.07) but both KD and SC zebrafish responded similarly to insulin (repeated measures ANOVA, NS). Treatment started immediately after the first measurement. Data are presented as mean values ± SEM

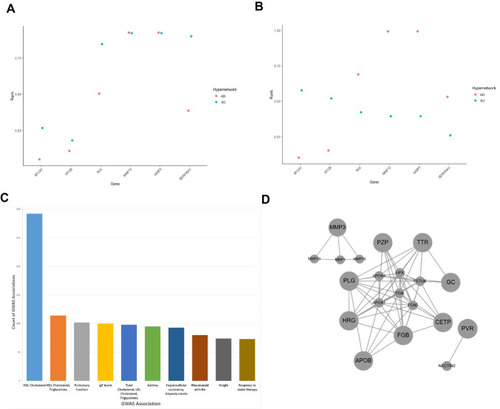
Genes associated with cardio-metabolic diseases. Cardio-metabolic disease GWAS genes ranked by normalized row sum in the age-related transcriptome hypergraphs of control and GRB10 knockdown zebrafish. Six genes out of 29 differentially expressed genes were present in both the SC and KD were shown to be related to cardiometabolic health. A) The impact of these genes on hypergraph connectivity and, B) higher order interactions in the transcriptome hypergraph were measured and ranked using a normalized ranking score, higher value indicates greater number of interactions in the transcriptome and implies greater impact on function by increased cross talk between biological pathways. C) Human Genome Wide Association Study (GWAS) relationships identified by phenome wide association using the fourteen human orthologous genes present in overlap between SC and KD hypergraphs. Identified using PHEWAS catalogue. D) Interactome model of the fourteen human orthologous genes present in overlap between SC and KD hypergraphs, demonstrating coherency and implying co-ordination

Acknowledgments
This image is the copyrighted work of the attributed author or publisher, and ZFIN has permission only to display this image to its users. Additional permissions should be obtained from the applicable author or publisher of the image. Full text @ Cell. Mol. Life Sci.