FIGURE

Fig. 7

ID
ZDB-FIG-250722-8
Publication
Evans et al., 2025 - Transcriptome remodelling and changes in growth and cardiometabolic phenotype result following Grb10a knockdown in the early life of the zebrafish
Other Figures
All Figure Page
Back to All Figure Page
Fig. 7

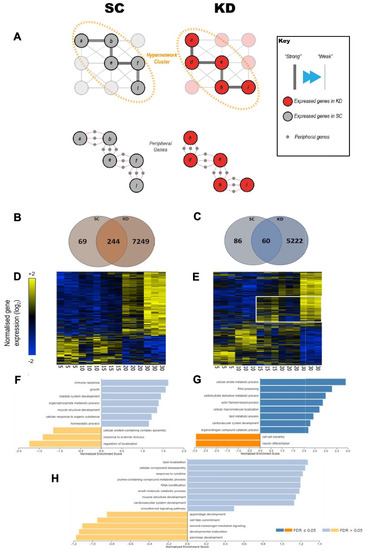
Analysis of the set of genes in the wider transcriptome shows a 27.8-fold increase in the KD ZF. (A) Identification of peripheral elements underpinning the hypergraph implicates a wider set of genes than the initial targets. A summary of those peripheral elements is presented here. (B, C) Venn diagrams of genes positively (B) and negatively (C) correlating with age. (D, E) Hierarchically clustered heat maps of gene expression of the genes identified in the wider transcriptome. Gene expression in the standard control (D) cluster into two age related groups, whereas expression in the knockdown (E) show significant dysregulation. (F, G) Gene set enrichment analysis (GSEA) ranked by R-value of rank age regression in the standard control (F) and knockdown (G). (H) GSEA ranked by R-value of rank age regression of the cluster of genes in the white box in (E)

Expression Data

Expression Detail
Antibody Labeling
Phenotype Data

Phenotype Detail
Acknowledgments
This image is the copyrighted work of the attributed author or publisher, and ZFIN has permission only to display this image to its users. Additional permissions should be obtained from the applicable author or publisher of the image. Full text @ Cell. Mol. Life Sci.