IMAGE

Fig. 5

ID
ZDB-IMAGE-250722-10
Source
Figures for Evans et al., 2025
Image
Figure Caption

Fig. 5

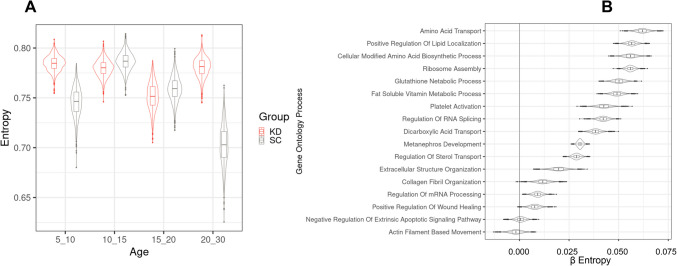
Hypergraph entropy in the transcriptome reveals differences over time and between functions. (A) hypergraphs were iterated using randomly selected genes and a moving window approach to assess change in transcriptomic entropy over time. SC and KD are significantly different at all time points (FDR < 2.4 × 10–11 ANOVA with Tukey post-hoc) though the largest differences exist at 5–10 dpf (fold change = 0.052) and 20–30 dpf (0.11). (B) hypergraphs were iteratively generated from genes attributed to each pathway and entropy was modelled across the two treatment groups. β values represent the difference in entropy between SC and KD, with a β value of 0 indicating no difference between groups. Positive β values represent higher entropy in SC compared to KD. Ontology classes are considered to be significantly different if the 89% CI of β values does not include 0. Actin filament-based movement and negative regulation of extrinsic apoptotic signalling pathway were the only two pathways with no difference identified between the groups

Acknowledgments
This image is the copyrighted work of the attributed author or publisher, and ZFIN has permission only to display this image to its users. Additional permissions should be obtained from the applicable author or publisher of the image. Full text @ Cell. Mol. Life Sci.