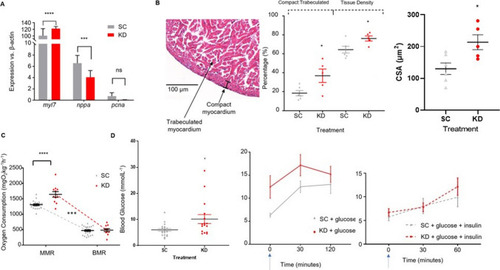
Cardiac gene expression and Cardiometabolic function in 18-month-old adult Zebrafish. (A) qPCR results of three genes associated with cardiac performance in adult cardiac tissue, relative to β-actin. Myl7 expression was significantly elevated in KD zebrafish (unpaired t-test, **** p < 0.0001) while nppa expression was significantly down regulated (*** p = 0.001) compared to SC zebrafish. There was no significant difference between the expression of pcna (p = 0.3). (B) Ventricular morphometrics obtained by Masson’s Trichrome histology comparing KD and SC compacta thickness, tissue density, and fiber cross sectional area. The compacta layer was significantly thicker (unpaired t-test, * p = 0.03) and overall tissue density was higher (* p = 0.03) in the KD zebrafish, and the fiber cross-sectional area (CSA) was increased (* p = 0.02) (n = 5–6). (C) Maximum (MMR) and Basal (BMR) oxygen uptake rate of adult (18 month) zebrafish, adjusted for body mass. BMR was comparable between the two groups (unpaired t-test, NS), while MMR was greater in the KD zebrafish (**** p < 0.0001), resulting in a greater aerobic scope (dotted line, unpaired t-test, *** p = 0.0007). (D) Fasting Glucose concentrations (left panel), glucose tolerance testing (centre panel) and insulin sensitivity testing (right panel) in adult (18 month) KD and SC zebrafish. Fasting glucose was higher in the KD (n = 16) than in the SC (n = 21) (unpaired t-test, p = 0.01). There were marginally higher glucose concentrations in the KD zebrafish in the glucose tolerance test (repeated measures ANOVA, p = 0.07) but both KD and SC zebrafish responded similarly to insulin (repeated measures ANOVA, NS). Treatment started immediately after the first measurement. Data are presented as mean values ± SEM
|
