
|
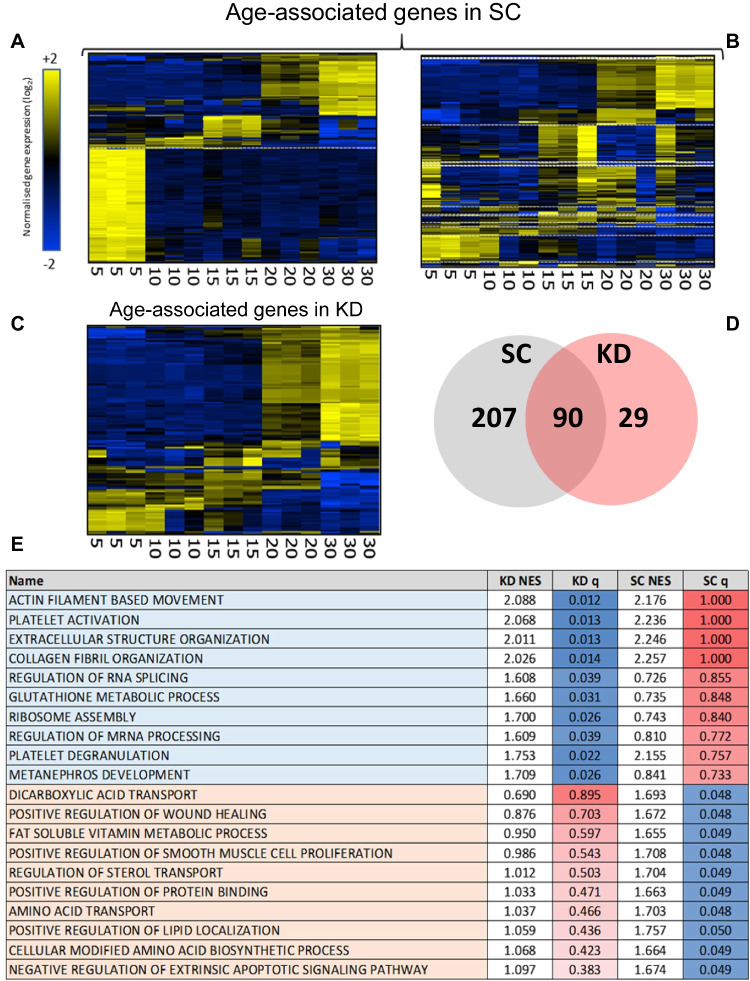
Fig. 4
Transcriptomic analysis of standard control and grb10a knockdown gene expression over the first 30 dpf. Hierarchically clustered heat maps of gene expression generated from an Affymetrix GeneChip™ Zebrafish Genome Array of SC and KD zebrafish RNA, taken at 5, 10, 15, 20, and 30 dpf. (