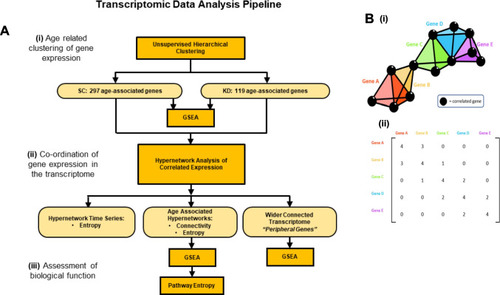
Pipeline of transcriptomic analysis and hypergraphs. (A) Analysis pipeline of transcriptomic data. (i) Unsupervised hierarchical clustering was performed to identify age-associated gene clusters. Genes were filtered by variance, using a projection score to maximise the informativeness of the genes selected. Clusters of age-associated genes were identified for SC and KD animals. (ii) hypergraphs were generated using age associated genes for each group. hypergraph structure was quantified using connectivity and entropy. Clusters of highly connected genes were identified, and a wider set of transcripts were implicated as important by identifying the complete subgraph between cluster nodes and edges in the hypergraph incidence matrix. (iii) Biological function was assessed in two ways. GSEA was performed using genes clustered by the hypergraph or implicated by the complete subgraph in the hypergraph incidence matrix. Secondly, biological processes identified by GSEA were assessed for functional activity using hypergraphs. Hypergraphs were iterated, using subsets of genes associated with each process, and hypergraph entropy was calculated. A Bayesian modelling approach was used to detect differences in entropy distributions between processes. (B) (i). A general model of a hypergraph, shown as a three-dimensional representation of genes (coloured tetrahedra) correlating with the expression of other genes (black spheres). Shared correlations are represented by matching vertices, edges, and faces of the tetrahedra. The dimensionality of the connection between genes is defined by the number of shared correlations between those genes. (ii). A hypergraph representation of the “higher order” interactions within the transcriptome. This summary of the correlations shared between genes can be considered as the incidence matrix of a multi-dimensional network
|
