IMAGE

Fig. 3

ID
ZDB-IMAGE-250722-7
Source
Figures for Evans et al., 2025
Image
Figure Caption

Fig. 3

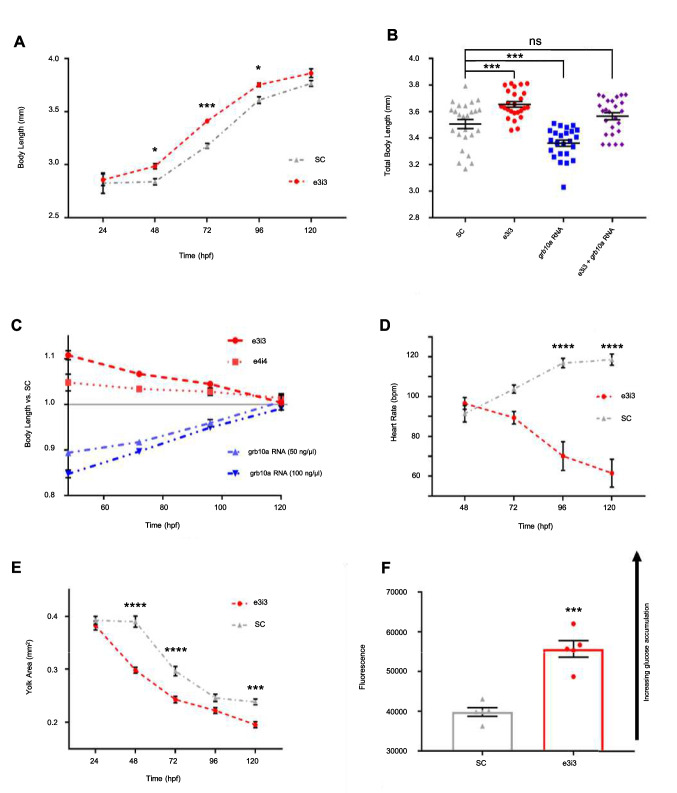
Growth and cardiometabolic phenotype are significantly impacted by early life grb10a knockdown. (A) Mean total body length ± SEM of SC and KD zebrafish from 24 to 120 hpf (multiple comparison 2-way ANOVA, * p < 0.05, *** p = 0.0003). (B) Mean total body length ± SEM and individual data points of 96 hpf zebrafish embryos (n = 25). Grb10a KD phenotype was reversed in grb10a overexpression zebrafish. Co-injection resulted in phenotype rescue. One-way ANOVA revealed KD zebrafish were significantly longer, while grb10a overexpression zebrafish were significantly smaller than SC (*** p = 0.0001). Rescue zebrafish were of similar length to SC (p = 0.38). (C) Mean body length measurements of the KD relative to SC ± SEM from 48 to 120hpf. (D) Mean heart rate ± SEM in beats per minute of SC and KD zebrafish (multiple comparison 2-way ANOVA, **** p < 0.0001). (E) Mean yolk area ± SEM of SC and KD embryos over the embryonic life stage (multiple comparisons 2-way ANOVA, *** p = 0.0004. (F) Glucose Uptake-Glo.™ Assay of 96 hpf KD and SC zebrafish, where higher luminescence indicates a greater accumulation of intracellular 2D6P. Luminescence was approximately 30% greater in KD zebrafish compared to SC (unpaired t-test, *** p = 0.0002)

Acknowledgments
This image is the copyrighted work of the attributed author or publisher, and ZFIN has permission only to display this image to its users. Additional permissions should be obtained from the applicable author or publisher of the image. Full text @ Cell. Mol. Life Sci.