FIGURE

Fig. 2

ID
ZDB-FIG-250722-2
Publication
Evans et al., 2025 - Transcriptome remodelling and changes in growth and cardiometabolic phenotype result following Grb10a knockdown in the early life of the zebrafish
Other Figures
All Figure Page
Back to All Figure Page
Fig. 2

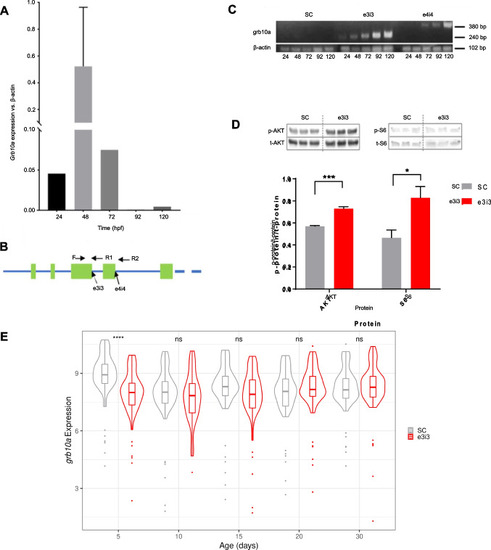
Grb10a is successfully knocked down in zebrafish injected with splice-blocking antisense oligonucleotides. (A) Grb10a qPCR of WT embryos (24–120 hpf, triplicated, n = 5 embryos per well). Data are shown as gene expression relative to β-actin with maximum levels at 48 hpf. (B) Schematic of the first five exons of the zebrafish grb10a gene. 5’ splice sites are highlighted with the forward and reverse primer triad indicated. (C) Multiplexed PCR amplification of the e3i3 and e4i4 splice site in embryos treated with either Standard Control (SC) morpholino, e3i3, or e4i4. β-actin was used as a positive control. (D) Western blot results of phosphorylated versus total protein ratios for two major signalling molecules of the insulin signalling pathway: AKT and S6. Quantitation using densitometry depicts mean + SEM. Activation of both proteins was found to be significantly elevated in KD zebrafish compared to SC (n = 3, unpaired t-test *** p = 0.0007, * p = 0.04). (E). Expression of grb10 mRNA throughout early life. Grb10 expression is decreased at 5 dpf in the KD but thereafter levels in the KD are not different from those in the SC (Wilcoxon rank sum test. **** p = 0.00003)

Expression Data

Expression Detail
Antibody Labeling
Phenotype Data

Phenotype Detail
Acknowledgments
This image is the copyrighted work of the attributed author or publisher, and ZFIN has permission only to display this image to its users. Additional permissions should be obtained from the applicable author or publisher of the image. Full text @ Cell. Mol. Life Sci.