
- Title
-
Telmisartan Reverses Hepatic Steatosis via PCK1 Upregulation: A Novel PPAR-independent Mechanism in Experimental Models of MASLD
- Authors
- Bentanachs, R., Ramírez-Carrasco, P., Braster, B., Emmanouilidou, A., Mujica, E., Rodrigo-Calvo, M., Rodríguez, C., Roglans, N., den Hoed, M., Laguna, J.C., Alegret, M.
- Source
- Full text @ Pharmacol. Res.
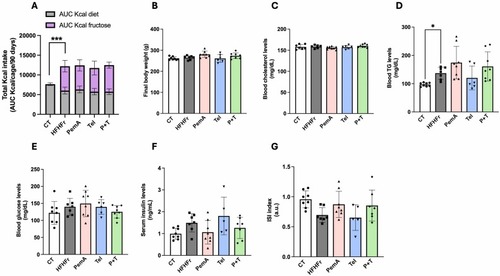
Drug treatment does not alter energy consumption, body weight circulating lipids or glucose levels. (A) Total calorie intake, expressed as area under the curve (AUC) in Kcal/cage/90 days. (B) Final body weight. Blood/serum concentrations of cholesterol (C), TG (D), glucose (E), insulin (F) and ISI values (G). Quantitative results are presented as bar plots with individual values, showing the mean ± SD of 6–8 animals/group. *P < 0.05, ***P < 0.001. |
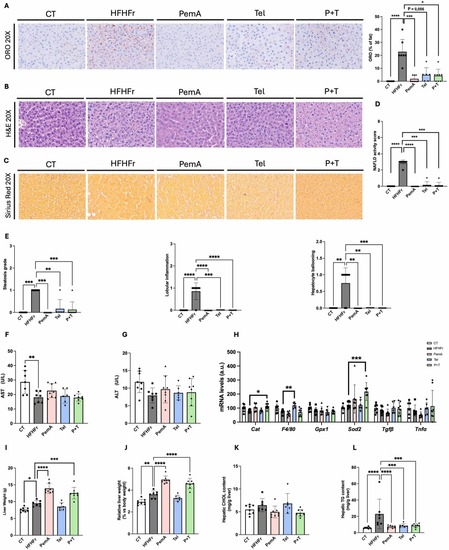
Treatment with PemA, Tel and their combination reduces the NAFLD activity score (NAS). Representative images of Oil Red O (A), Hematoxylin-Eosin (B) and Sirius Red (C) stained sections of liver samples, along with the corresponding histological analysis of CT, HFHFr, PemA, Tel and P + T groups. (D) shows NAFLD activity score, and (E) the subcomponent scores. Serum levels of AST (F), ALT (G), and (H) relative mRNA levels of markers of inflammation/oxidative stress and fibrosis. Absolute (I) and relative (J) liver weight. Hepatic content of cholesterol (K) and TG (L). Quantitative results are presented as bar plots with individual values, showing the mean ± SD of 6–8 animals/group. *P < 0.05, **P < 0.01, ***P < 0.001, ****P < 0.0001. |
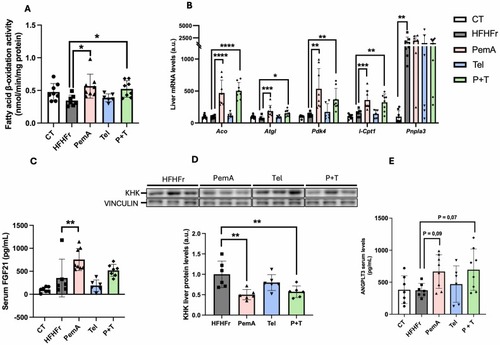
Treatment with PemA increased hepatic fatty acid oxidation. (A) Fatty acid β-oxidation activity and (B) mRNA levels of genes related to fatty acid catabolism. Serum FGF21 (C) and ANGPTL3 (E) levels from all experimental groups. (D) Relative content of KHK protein levels in liver samples, along with the representative Western Blot bands from HFHFr, PemA, Tel and P + T groups. Quantitative results are presented as bar plots with individual values, showing the mean ± SD of 6–8 animals/group. *P < 0.05, **P < 0.01, ***P < 0.001, ****P < 0.0001. |
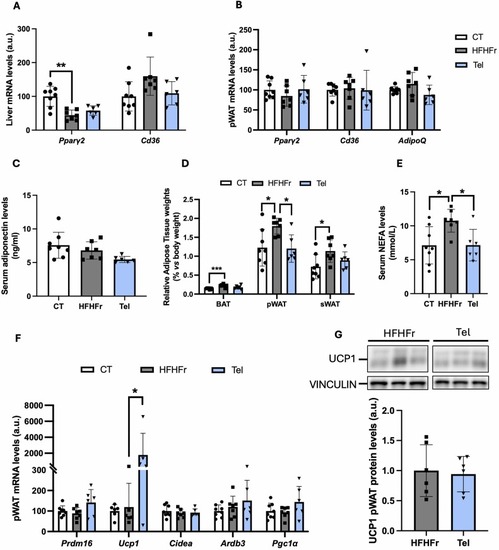
The antisteatotic effect of telmisartan is PPARƴ-independent. Relative mRNA levels of PPARƴ target genes in liver (A) and pWAT (B) from CT, HFHFr and Tel groups. (C) Serum adiponectin levels, (D) relative weights of BAT, pWAT and sWAT and (E) serum NEFA concentrations in CT, HFHFr and Tel groups. (F) Relative mRNA levels of browning markers in pWAT from CT, HFHFr and Tel groups. (G) UCP1 protein levels in pWAT from HFHFr and Tel groups. On the upper part of the figure, representative western blot bands corresponding to the mentioned groups. Quantitative results are presented as bar plots with individual values, showing the mean ± SD of 6–8 animals/group. *P < 0.05. |
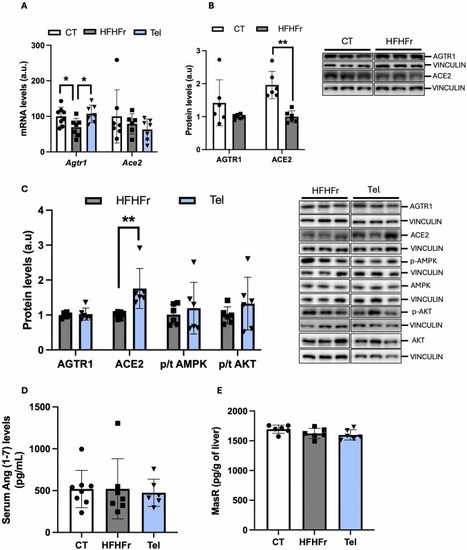
Effects of telmisartan treatment on the renin angiotensin system. (A) Relative liver Ace2 and Agtr1 mRNA levels in the livers of CT, HFHFr and CT groups. (B) Relative liver protein levels of ACE2 and AGTR1 from CT and HFHFr groups. (C) Relative liver protein levels of ACE2, AGTR1, phosphor/total AMPK and phosphor/total AKT from HFHFr and Tel groups. On the right part of the Figs. B and C, representative western blot bands corresponding to the mentioned groups. Serum Ang (1−7) (D) and MasR liver protein levels (E) from CT, HFHFr and Tel groups. Quantitative results are presented as bar plots with individual values, showing the mean ± SD of 6–8 animals/group. *P < 0.05. |
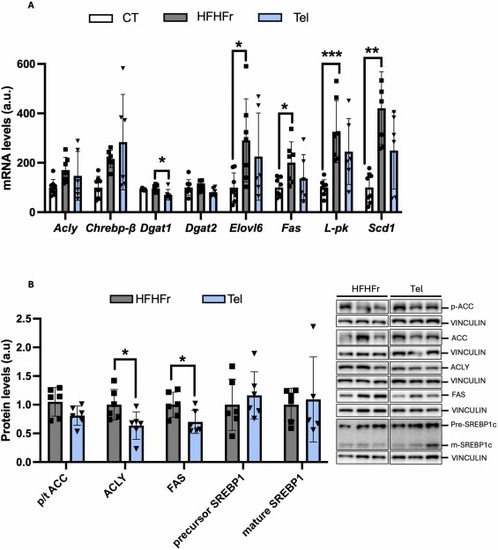
Effects of telmisartan treatment on key enzymes involved in de novo lipogenesis (DNL). Relative mRNA (A) and protein levels (B) of liver DNL markers. On the right part of the figure, representative western blot bands corresponding to HFHFr and Tel groups are shown. Quantitative results are presented as bar plots with individual values, showing the mean ± SD of 6–8 animals/group. *P < 0.05. |
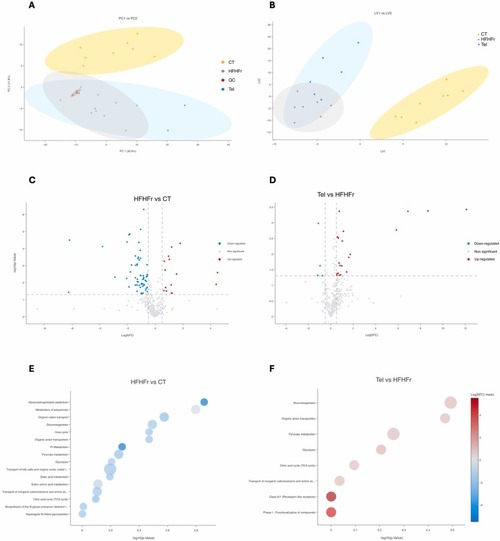
Metabolomic analysis of liver samples from CT, HFHFr Tel groups. Principal component analysis (A) and partial least squares discriminant analysis (B) showing the clustering patterns and separation of metabolic profiles from the different groups. Volcano plots highlighting significant differences (P < 0.05, |Log₂FC| > 0.5, colored) in HFHFr vs. CT (C) and Tel vs. HFHFr (D). Pathway enrichment analysis using Over-Representation Analysis with metabolites that were significantly altered (P < 0.05, |Log₂FC| > 0.5) in the HFHFr vs. CT (E) and Tel vs. HFHFr (F) comparisons. Dot size is proportional to the number of hits per pathway. |
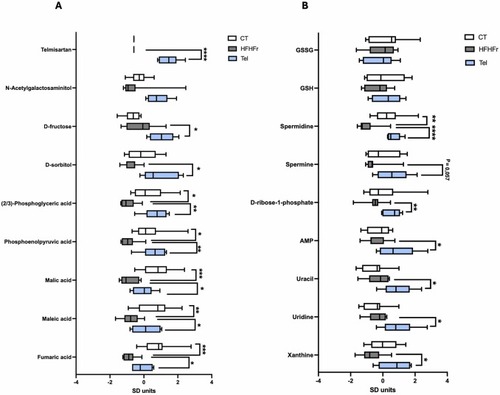
Relevant liver metabolites involved in the antisteatotic effect of telmisartan. Box plots showing the levels of metabolites involved in gluconeogenesis and polyol pathways (A), and those related to pentose phosphate pathway and purine/pyrimidine metabolism (B). Metabolite signal intensities were Z-score normalized for plotting purposes. Statistical analysis was performed with raw data from 6 to 8 animals per group. *P < 0.05. **P < 0.01, ***P < 0.001, ****P < 0.0001. |
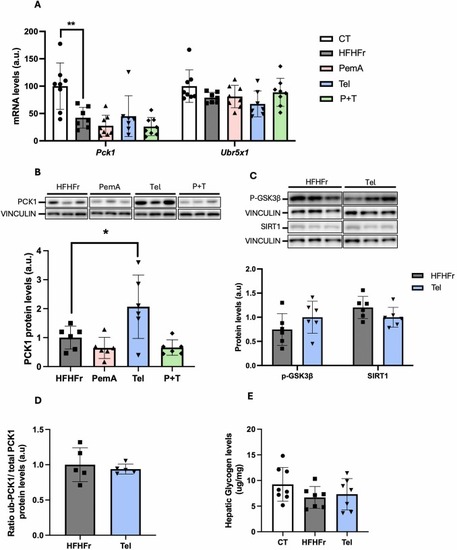
Telmisartan effects on PCK1 expression. (A) Relative liver mRNA levels of Pck1 and Ubr5 from CT, HFHF and Tel groups. (B, C) Relative liver protein levels of PCK1, p-GSK3β and SIRT1 from the corresponding experimental groups. On the upper part of the figures, representative western blot bands are shown. (D) Ubiquitinated PCK1 protein levels relative to total PCK1 protein levels in the livers from CT, HFHFr and Tel groups. (E) Hepatic glycogen content from CT, HFHFr and Tel groups. Quantitative results are presented as bar plots with individual values, showing the mean ± SD of 6–8 animals/group. *P < 0.05, **P < 0.01. |
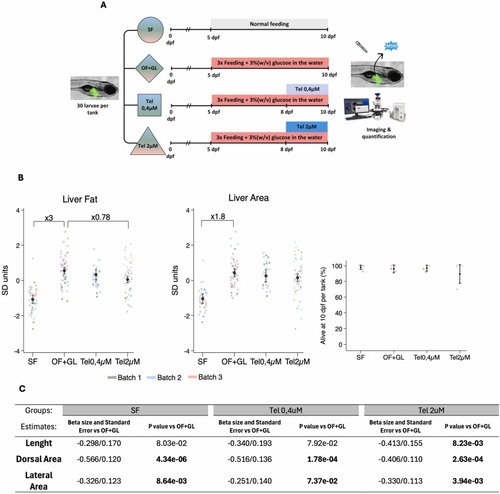
Telmisartan effects on OF+GL model. (A) Schematic representation of the experimental design. (B) Scatter plot of the normalized (Z-score) Liver Lipid Area and Liver Area individual values along with margin plots in the SF, OF+GL and Tel at different concentrations. Scatter plot, mean and standard deviation of the survival rate (%) in experimental tanks from 8 to 10 days post fertilization from CT, OF+GL, Tel 0.4 µM and Tel 2 µM groups. (C) Length, Dorsal Area and Lateral Area of SF, Tel 0.4 µM or Tel 2 µM vs OF+GL group. Analysis was performed using multiple linear regression adjusting the values by “Time of day” and “Batch” (3 Batches). Dorsal and lateral area were additionally adjusted by length. Fold change calculated using raw data is indicated when the differences are statistically significant (P < 0,05) between indicated groups. |
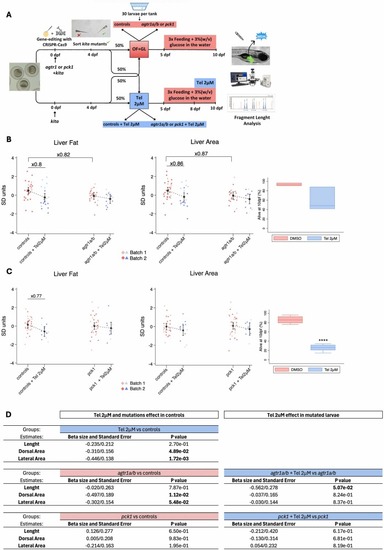
Evaluation of the effects of agtr1 or pck1 mutations, telmisartan treatment or both in OF+GL fed larvae. (A) Schematic representation of the experimental design. Scatter plot of the inversely normalized Liver Lipid Area and Liver Area individual values, along with margin plots for the untreated and treated controls as well as for their respective untreated and treated agtr1a/b (B) or pck1 (C) mutant siblings. Box plots showing the survival rate (%) in Telmisartan 2 µM treated or untreated experimental tanks from 8 to 10 days post fertilization. (D) Effect of mutations and telmisartan treatment or both on Length, Dorsal and Lateral area. Analysis was performed using multiple linear regression adjusting the values by “Time of day” and “Batch” (2 Batches). Fold change calculated using raw data is indicated when the differences are statistically significant (P < 0,05) between groups differing by a single variable. |
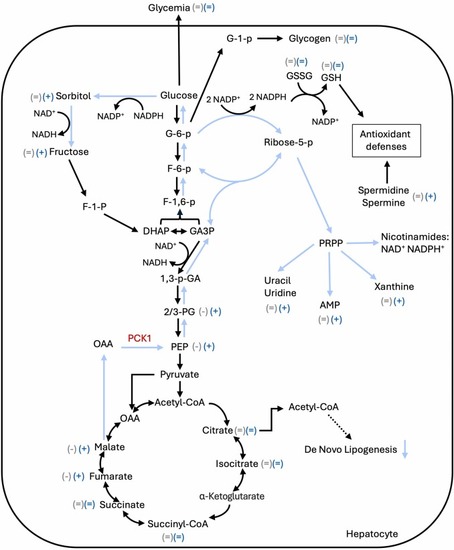
Telmisartan proposed mechanism of action. Blue arrows correspond to the direction of the metabolic flux following telmisartan treatment. Grey and blue sings next to the metabolites indicate the metabolomic analysis results for the HFHFr and Tel groups respectively. 1,3-p-GA: 1,3-phosphoglyceric acid; 2/3-PG: 2/3-phosphoglyceric acid; DHAP: dihydroxyacetone phosphate; F-1-p: fructose 1-phosphate; F-1,6-p: fructose 1,6-diphosphate; F-6-p: fructose 6-phosphate; G-6-p: glucose 6-phosphate; GA3P: glyceraldehyde 3-phosphate; GSH: reduced glutathione; GSSG: oxidized glutathione; OAA: oxalacetate; PCK1: phosphoenolpyruvate carboxykinase 1; PEP: phosphoenolpyruvic acid; PRPP: phosphoribosyl pyrophosphate. |