
Fig. 7
- ID
- ZDB-FIG-250821-25
- Publication
- Bentanachs et al., 2025 - Telmisartan Reverses Hepatic Steatosis via PCK1 Upregulation: A Novel PPAR-independent Mechanism in Experimental Models of MASLD
- Other Figures
- All Figure Page
- Back to All Figure Page
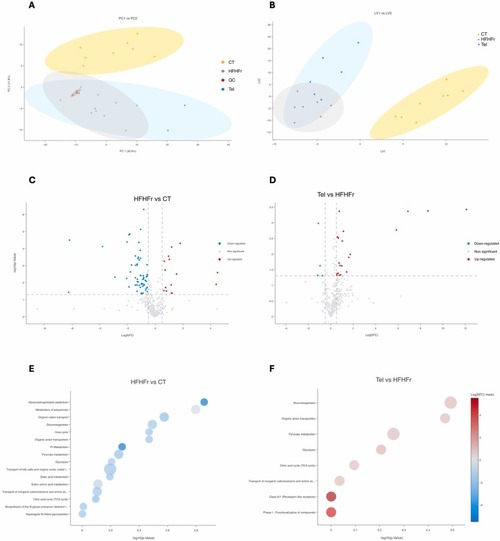
Metabolomic analysis of liver samples from CT, HFHFr Tel groups. Principal component analysis (A) and partial least squares discriminant analysis (B) showing the clustering patterns and separation of metabolic profiles from the different groups. Volcano plots highlighting significant differences (P < 0.05, |Log₂FC| > 0.5, colored) in HFHFr vs. CT (C) and Tel vs. HFHFr (D). Pathway enrichment analysis using Over-Representation Analysis with metabolites that were significantly altered (P < 0.05, |Log₂FC| > 0.5) in the HFHFr vs. CT (E) and Tel vs. HFHFr (F) comparisons. Dot size is proportional to the number of hits per pathway. |