
|
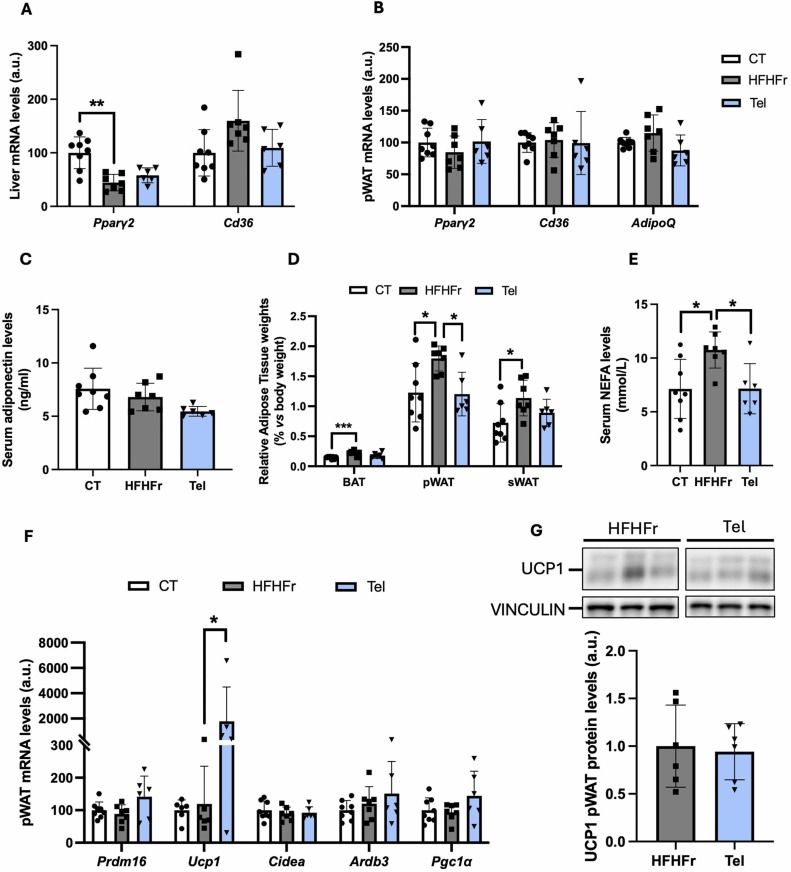
Fig. 4 The antisteatotic effect of telmisartan is PPARƴ-independent. Relative mRNA levels of PPARƴ target genes in liver (A) and pWAT (B) from CT, HFHFr and Tel groups. (C) Serum adiponectin levels, (D) relative weights of BAT, pWAT and sWAT and (E) serum NEFA concentrations in CT, HFHFr and Tel groups. (F) Relative mRNA levels of browning markers in pWAT from CT, HFHFr and Tel groups. (G) UCP1 protein levels in pWAT from HFHFr and Tel groups. On the upper part of the figure, representative western blot bands corresponding to the mentioned groups. Quantitative results are presented as bar plots with individual values, showing the mean ± SD of 6–8 animals/group. *P < 0.05.