
|
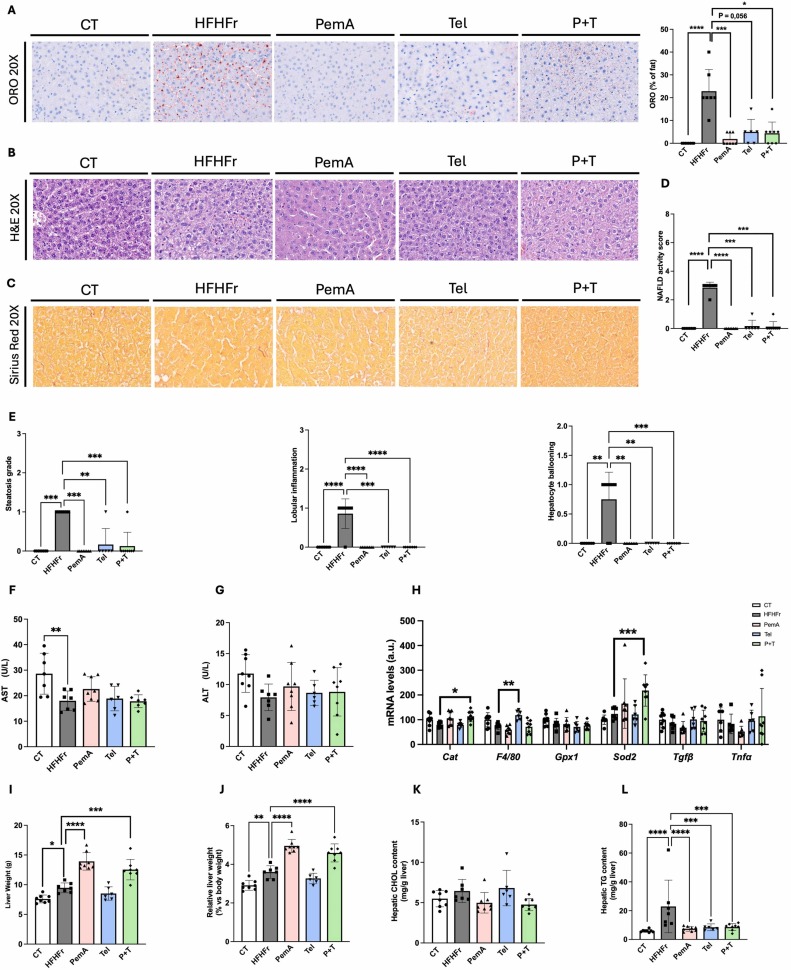
Fig. 2 Treatment with PemA, Tel and their combination reduces the NAFLD activity score (NAS). Representative images of Oil Red O (A), Hematoxylin-Eosin (B) and Sirius Red (C) stained sections of liver samples, along with the corresponding histological analysis of CT, HFHFr, PemA, Tel and P + T groups. (D) shows NAFLD activity score, and (E) the subcomponent scores. Serum levels of AST (F), ALT (G), and (H) relative mRNA levels of markers of inflammation/oxidative stress and fibrosis. Absolute (I) and relative (J) liver weight. Hepatic content of cholesterol (K) and TG (L). Quantitative results are presented as bar plots with individual values, showing the mean ± SD of 6–8 animals/group. *P < 0.05, **P < 0.01, ***P < 0.001, ****P < 0.0001.