
|
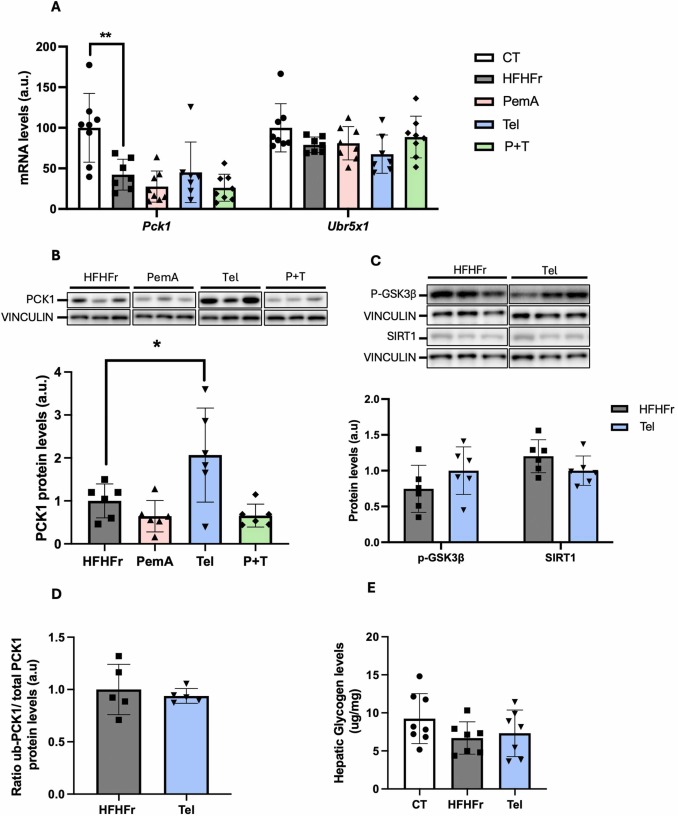
Fig. 9 Telmisartan effects on PCK1 expression. (A) Relative liver mRNA levels of Pck1 and Ubr5 from CT, HFHF and Tel groups. (B, C) Relative liver protein levels of PCK1, p-GSK3β and SIRT1 from the corresponding experimental groups. On the upper part of the figures, representative western blot bands are shown. (D) Ubiquitinated PCK1 protein levels relative to total PCK1 protein levels in the livers from CT, HFHFr and Tel groups. (E) Hepatic glycogen content from CT, HFHFr and Tel groups. Quantitative results are presented as bar plots with individual values, showing the mean ± SD of 6–8 animals/group. *P < 0.05, **P < 0.01.