
Image
|
Figure Caption
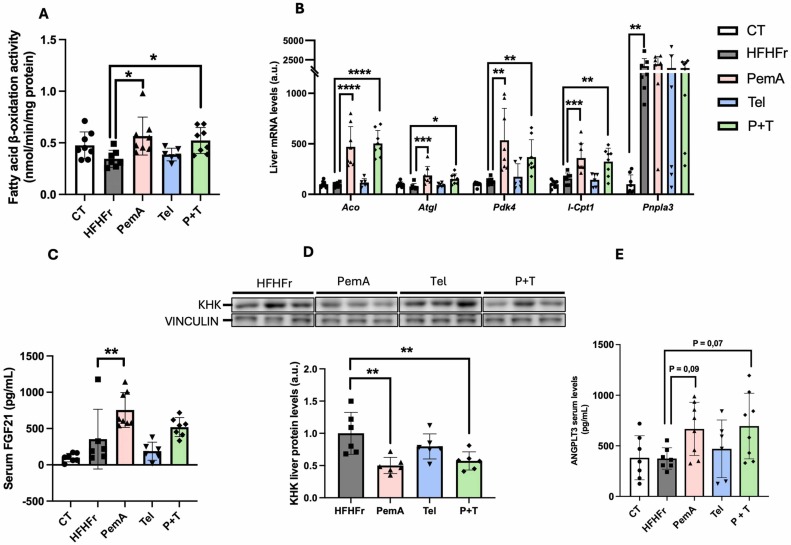
Fig. 3 Treatment with PemA increased hepatic fatty acid oxidation. (A) Fatty acid β-oxidation activity and (B) mRNA levels of genes related to fatty acid catabolism. Serum FGF21 (C) and ANGPTL3 (E) levels from all experimental groups. (D) Relative content of KHK protein levels in liver samples, along with the representative Western Blot bands from HFHFr, PemA, Tel and P + T groups. Quantitative results are presented as bar plots with individual values, showing the mean ± SD of 6–8 animals/group. *P < 0.05, **P < 0.01, ***P < 0.001, ****P < 0.0001.
Acknowledgments
This image is the copyrighted work of the attributed author or publisher, and
ZFIN has permission only to display this image to its users.
Additional permissions should be obtained from the applicable author or publisher of the image.
Full text @ Pharmacol. Res.