
Image
|
Figure Caption
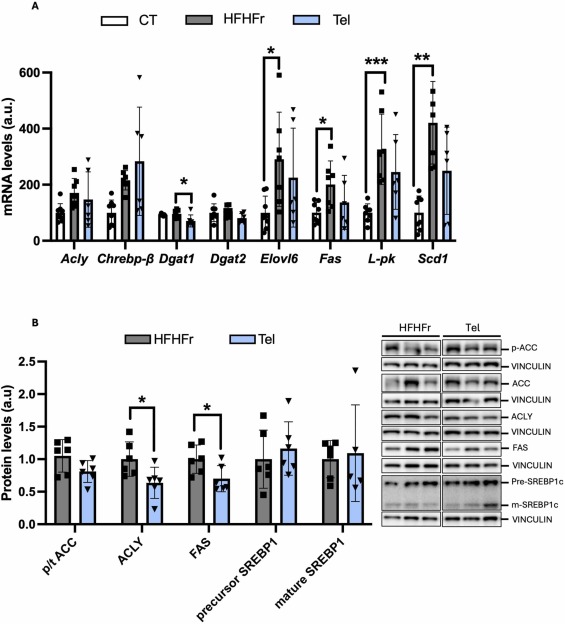
Fig. 6 Effects of telmisartan treatment on key enzymes involved in de novo lipogenesis (DNL). Relative mRNA (A) and protein levels (B) of liver DNL markers. On the right part of the figure, representative western blot bands corresponding to HFHFr and Tel groups are shown. Quantitative results are presented as bar plots with individual values, showing the mean ± SD of 6–8 animals/group. *P < 0.05.
Acknowledgments
This image is the copyrighted work of the attributed author or publisher, and
ZFIN has permission only to display this image to its users.
Additional permissions should be obtained from the applicable author or publisher of the image.
Full text @ Pharmacol. Res.