
Image
|
Figure Caption
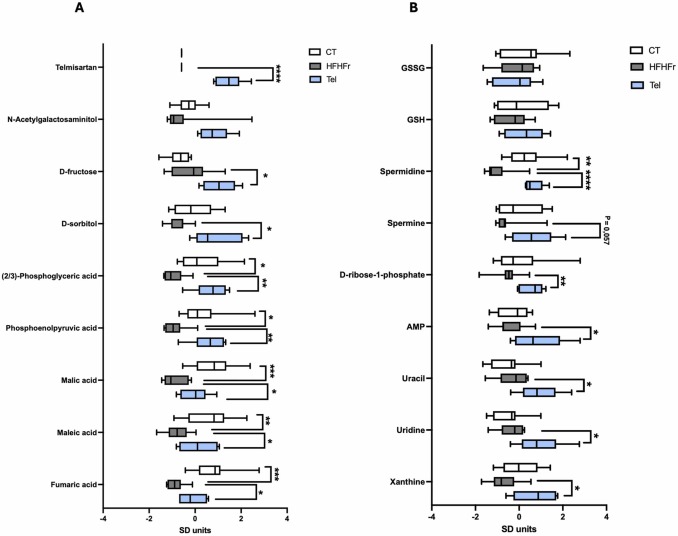
Fig. 8 Relevant liver metabolites involved in the antisteatotic effect of telmisartan. Box plots showing the levels of metabolites involved in gluconeogenesis and polyol pathways (A), and those related to pentose phosphate pathway and purine/pyrimidine metabolism (B). Metabolite signal intensities were Z-score normalized for plotting purposes. Statistical analysis was performed with raw data from 6 to 8 animals per group. *P < 0.05. **P < 0.01, ***P < 0.001, ****P < 0.0001.
Acknowledgments
This image is the copyrighted work of the attributed author or publisher, and
ZFIN has permission only to display this image to its users.
Additional permissions should be obtained from the applicable author or publisher of the image.
Full text @ Pharmacol. Res.