
|
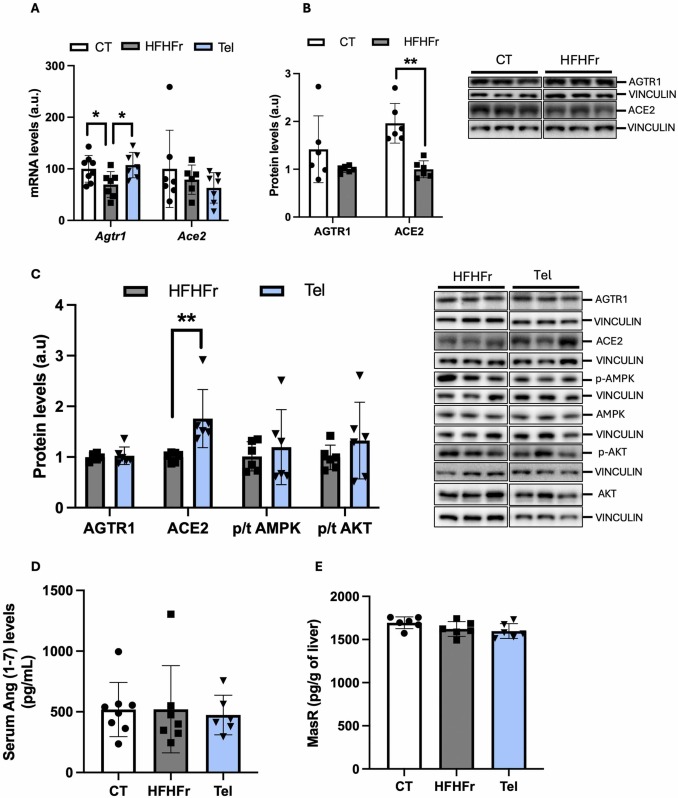
Fig. 5 Effects of telmisartan treatment on the renin angiotensin system. (A) Relative liver Ace2 and Agtr1 mRNA levels in the livers of CT, HFHFr and CT groups. (B) Relative liver protein levels of ACE2 and AGTR1 from CT and HFHFr groups. (C) Relative liver protein levels of ACE2, AGTR1, phosphor/total AMPK and phosphor/total AKT from HFHFr and Tel groups. On the right part of the Figs. B and C, representative western blot bands corresponding to the mentioned groups. Serum Ang (1−7) (D) and MasR liver protein levels (E) from CT, HFHFr and Tel groups. Quantitative results are presented as bar plots with individual values, showing the mean ± SD of 6–8 animals/group. *P < 0.05.