
|
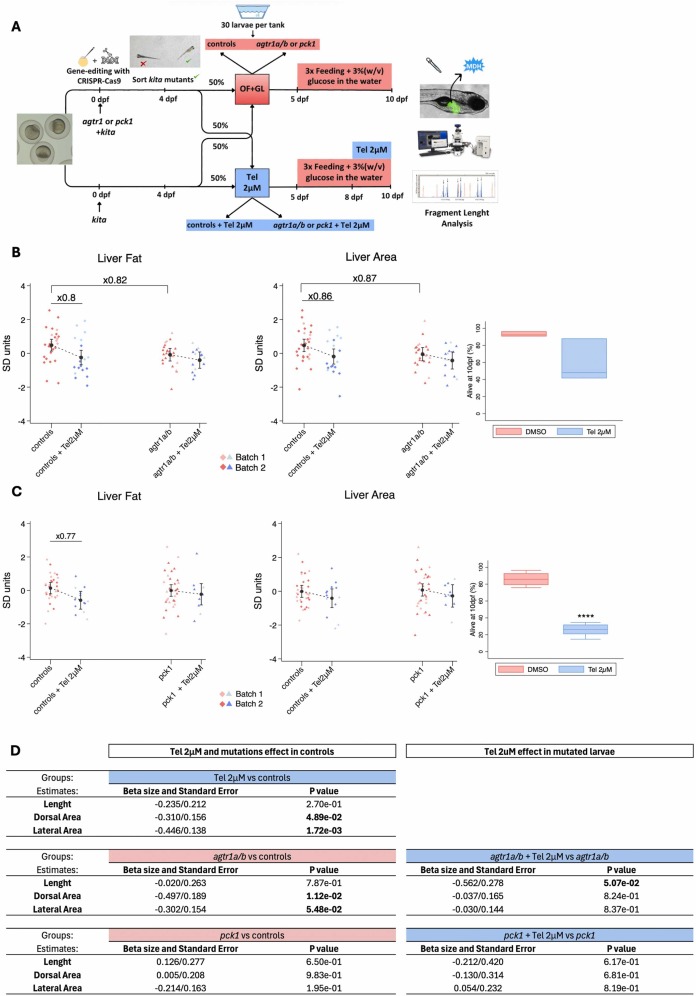
Fig. 11 Evaluation of the effects of agtr1 or pck1 mutations, telmisartan treatment or both in OF+GL fed larvae. (A) Schematic representation of the experimental design. Scatter plot of the inversely normalized Liver Lipid Area and Liver Area individual values, along with margin plots for the untreated and treated controls as well as for their respective untreated and treated agtr1a/b (B) or pck1 (C) mutant siblings. Box plots showing the survival rate (%) in Telmisartan 2 µM treated or untreated experimental tanks from 8 to 10 days post fertilization. (D) Effect of mutations and telmisartan treatment or both on Length, Dorsal and Lateral area. Analysis was performed using multiple linear regression adjusting the values by “Time of day” and “Batch” (2 Batches). Fold change calculated using raw data is indicated when the differences are statistically significant (P < 0,05) between groups differing by a single variable.