
Image
|
Figure Caption
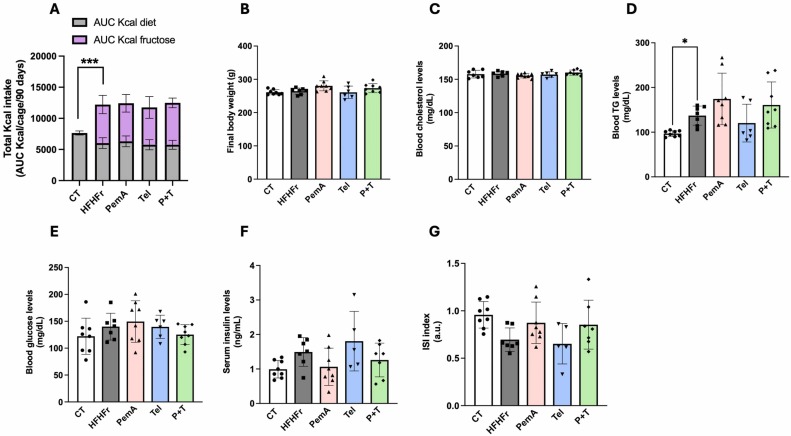
Fig. 1 Drug treatment does not alter energy consumption, body weight circulating lipids or glucose levels. (A) Total calorie intake, expressed as area under the curve (AUC) in Kcal/cage/90 days. (B) Final body weight. Blood/serum concentrations of cholesterol (C), TG (D), glucose (E), insulin (F) and ISI values (G). Quantitative results are presented as bar plots with individual values, showing the mean ± SD of 6–8 animals/group. *P < 0.05, ***P < 0.001.
Acknowledgments
This image is the copyrighted work of the attributed author or publisher, and
ZFIN has permission only to display this image to its users.
Additional permissions should be obtained from the applicable author or publisher of the image.
Full text @ Pharmacol. Res.