
|
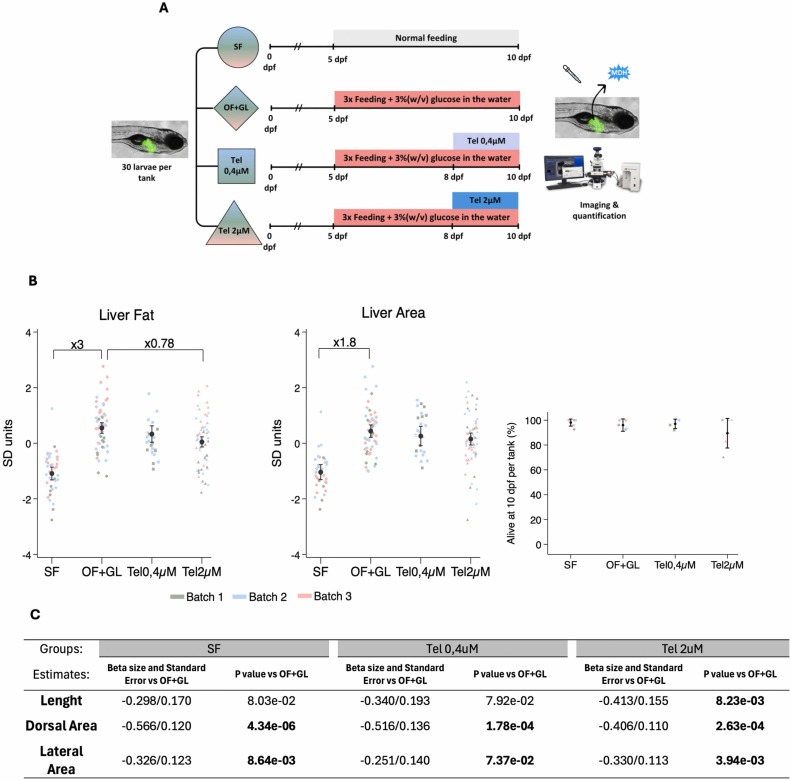
Fig. 10 Telmisartan effects on OF+GL model. (A) Schematic representation of the experimental design. (B) Scatter plot of the normalized (Z-score) Liver Lipid Area and Liver Area individual values along with margin plots in the SF, OF+GL and Tel at different concentrations. Scatter plot, mean and standard deviation of the survival rate (%) in experimental tanks from 8 to 10 days post fertilization from CT, OF+GL, Tel 0.4 µM and Tel 2 µM groups. (C) Length, Dorsal Area and Lateral Area of SF, Tel 0.4 µM or Tel 2 µM vs OF+GL group. Analysis was performed using multiple linear regression adjusting the values by “Time of day” and “Batch” (3 Batches). Dorsal and lateral area were additionally adjusted by length. Fold change calculated using raw data is indicated when the differences are statistically significant (P < 0,05) between indicated groups.