FIGURE SUMMARY
Title

A zebrafish model of acmsd deficiency does not support a prominent role for ACMSD in Parkinson's disease

Authors
Fargher, E., Keatinge, M., Pearce, O., Piepponen, P., Panula, P., van Eeden, F.J.M., MacDonald, R.B., Bandmann, O.
Source
Full text @ NPJ Parkinsons Dis

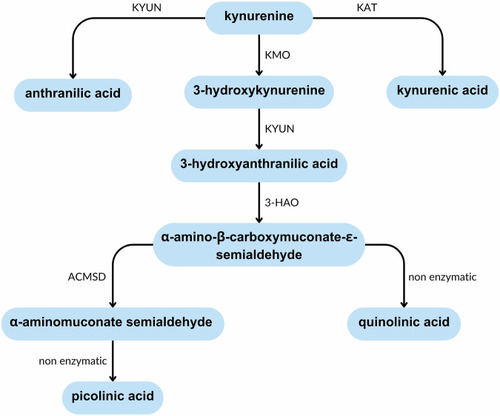
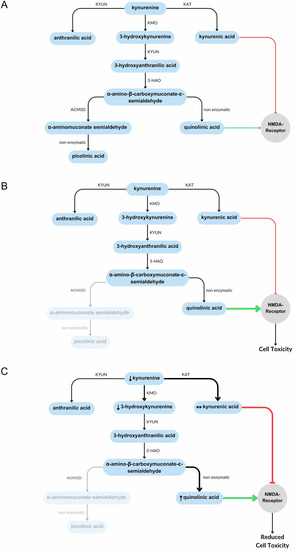
Summary of the kynurenine pathway.

The kynurenine pathway is involved in the catabolism of tryptophan. The production of picolinic acid is considered an anti-inflammatory branch of the pathway, whist the production of quinolinic acid is considered pro-inflammatory due to its ability to activate immune cells and induce cell death. ACMSD acts at a branching point in this pathway that determines which of these products is created. 3-HAO 3-hydroxyanthranilate oxidase, ACMSD α-amino-β-carboxymuconate-ε-semialdehyde decarboxylase, KAT kynurenine aminotransferase, KMO kynurenine-3-monooxygenase, KYUN kynureninase.

acmsd is expressed primarily in the liver and intestines of wildtype zebrafish.

A Exonic structure of ACMSD. Human ACMSD (ENSG00000153086) has a single orthologue in zebrafish (ENSDARG00000062549) which shares 81% sequence homology with its human counterpart (based on CLUSTAL W v1.81 data). B Synteny has been retained between species. The region comparison feature on Ensembl was used to compare a 1 Mb region around the Acmsd gene on human chromosome 2 and zebrafish chromosome 9. Not all genes in the region are included. Orthologous genes are identified by arrows. C RT-PCR demonstrated acmsd expression with an increasing concentration from 1 to 5dpf in acmsd+/+ larvae. In situ hybridisation demonstrated restricted acmsd expression to the liver (arrows) and gut at 3dpf, shown from lateral (F) and dorsal (G) views. The sense probe produced no staining (D, E). H RT-PCR demonstrated acmsd expression primarily in the liver and intestines of both adult male (shown) and adult female (not shown) zebrafish. Expression was also identified in the brain, kidney, gonad,s and gall bladder.

EXPRESSION / LABELING:
Gene:
Fish:
Anatomical Terms:
Stage Range: Prim-5 to Adult

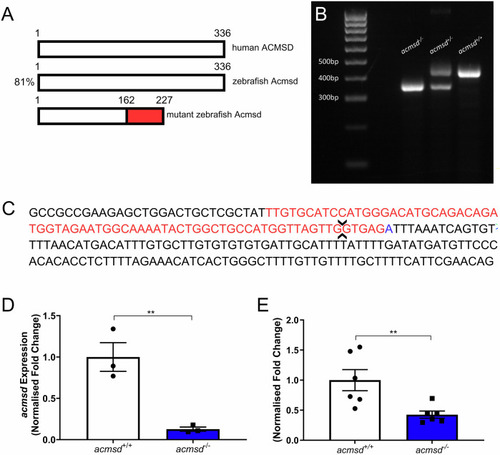
CRIPSR-generated mutation in
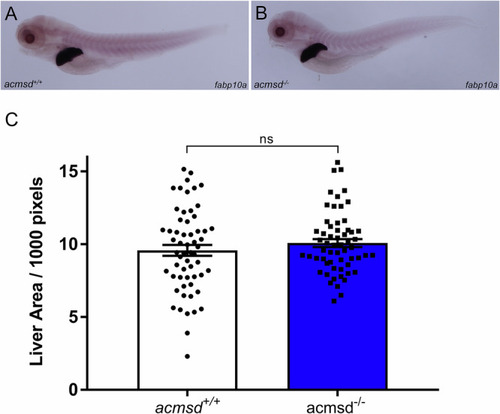
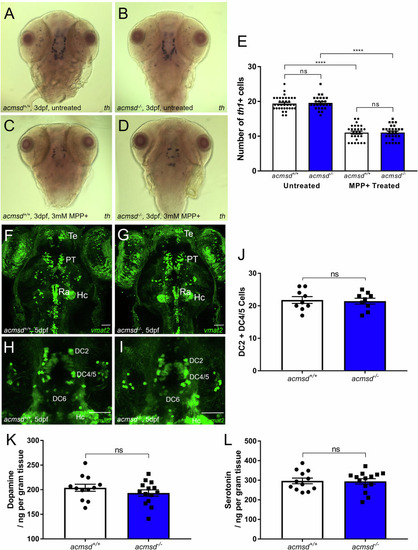
 acmsd causes nonsense-mediated decay of resulting mRNA.

A Zebrafish express a single Acmsd protein, sharing 81% protein identity to human ACMSD. A mutation was introduced into exon 6 using CRISPR/Cas9 resulting in a predicted truncated protein. Red region depicts altered amino acids in the mutated protein. B The resulting 70 bp reduction in DNA length allowed for genotyping by standard PCR. acmsd+/+ zebrafish were identified by a single 425 bp band (right), homozygous acmsd-/- mutants by a 355 bp band (left), and heterozygous acmsd+/- mutants by a double band (centre). C DNA sequence of acmsd exon 6 and intron 6. acmsd-/- zebrafish possessed a 71 bp deletion (red) and 1 bp insertion (blue) in this region, resulting in the loss of a 3’ splice site (arrows). acmsd-/- larvae demonstrated reduced acmsd expression compared to their acmsd+/+ siblings at 5dpf (D, n = 3 biological replicates (15 larvae per replicate), p = 0.0012) and in adult brain tissue (E, n = 6 biological replicates (1 brain per replicate), p = 0.0040). Statistics from two-tailed t tests using ddCt values.

EXPRESSION / LABELING:
Gene:
Fish:
Anatomical Terms:
Stage Range: Day 5 to Adult
PHENOTYPE:
Fish:
Observed In:
Stage Range: Day 5 to Adult

Liver size does not vary between acmsd+/+ and acmsd-/- larvae.

5dpf zebrafish underwent in situ hybridisation against fatty acid-binding protein 10a (fabp10a, A, B, representative images). C There was no difference in liver area identified between genotypes (p = 0.2762, unpaired two-tailed t test). Data from three biological replicates, n = 59 per genotype. Data points represent individual fish.

EXPRESSION / LABELING:
Gene:
Fish:
Anatomical Term:
Stage: Day 5
PHENOTYPE:
Fish:
Observed In:
Stage: Day 5

acmsd mutant zebrafish demonstrate normal swimming behaviour.

A Following habituation, 5dpf larvae were exposed to alternating dark (black bar)-light (white bar) cycles. B Total distance travelled was indistinguishable between genotypes (Kruskal-Wallis one-way ANOVA, p = 0.1902). n = 45 acmsd-/-; 62 acmsd+/-; 35 acmsd+/+ from three biological replicates. C Following a habituation period, adult movement was recorded over 6 h at 9mpf. D. No difference in the total distance travelled was found between genotypes (unpaired two-tailed t test, p = 0.1796). n = 10 acmsd-/-; 10 acmsd+/+ (equal male/female ratio) taken at two separate time points. Graphs A + C show mean ± SEM. Graphs B + D show individual fish with mean ± SEM values.

acmsd-/- zebrafish retain normal dopaminergic neuron numbers and susceptibility to MPP +.

AD In situ hybridisation against th1 showed no change in staining pattern between acmsd+/+ and acmsd-/- zebrafish either before or after MPP+ exposure. E There was no difference in th1+ neuron numbers in the ventral diencephalon between acmsd+/+ and acmsd-/- zebrafish (p = 0.9866). MPP+ exposure resulted in significant reductions in th1+ cells irrespective of genotype (43.1% in acmsd+/+; 43.4% in acmsd-/-, p < 0.0001). Total cell counts between groups following exposure remained indistinguishable (p = 0.9999). n = 26–35 per group, from three biological replicates. Statistics from a two-way ANOVA with Tukey’s multiple comparisons post-hoc test. Monoaminergic neurons were visualised using the ETvmat2:GFP transgenic line at 5dpf in the full brain (F, G dorsal view) and in the DC neuronal groups (H, I) in both acmsd+/+ and acmsd-/- zebrafish. Scale bar = 50 µm. DC diencephalic neurons, Hc caudal hypothalamus, PT pretectal neural cluster, Ra raphe nucleus, Te telencephalic neurons. J No difference in the number of neuronal cell bodies in DC2 and DC4/5 was seen between acmsd+/+ and acmsd-/- zebrafish (p = 0.8126, unpaired two-tailed t test). n = 9 per genotype, from three biological replicates.No difference in the concentrations of dopamine (K, p = 0.2808) or serotonin (L, p = 0.9079) were identified in whole 11mpf brains. Data analysed using an unpaired two-tailed t test. n = 14 acmsd-/-; 12 acmsd+/+, 1 brain per replicate.

acmsd-/- zebrafish retain normal numbers and activation of microglia.

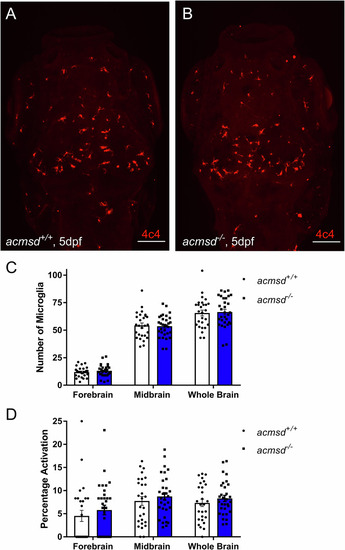
Representative images from wholemount immunohistochemistry against 4c4 in acmsd+/+ (A) and acmsd-/- (B) siblings at 5dpf (scale bar = 100 µm). C No difference was found in the number of 4c4+ cells between acmsd+/+ and acmsd-/- larvae in the forebrain, midbrain, or these combined (whole brain) (p = 0.9827 for forebrain, p = 0.9925 for midbrain, p = 0.9836 for whole brain). D No difference in microglial activation, represented as the percentage of amoeboid cells out of the total 4c4+ cell count, was identified between genotypes (p = 0.6983 for forebrain, p = 0.8307 for midbrain, p = 0.8441 for whole brain). n = 31 acmsd-/-, 27 acmsd+/+, from three biological replicates. Statistics analysed by two-way ANOVA with post hoc Sidak’s multiple comparisons test.

EXPRESSION / LABELING:
Antibody:
Fish:
Anatomical Term:
Stage: Day 5
PHENOTYPE:
Fish:
Observed In:
Stage: Day 5

acmsd-/- larvae demonstrate normal expression of three key proinflammatory mediators.

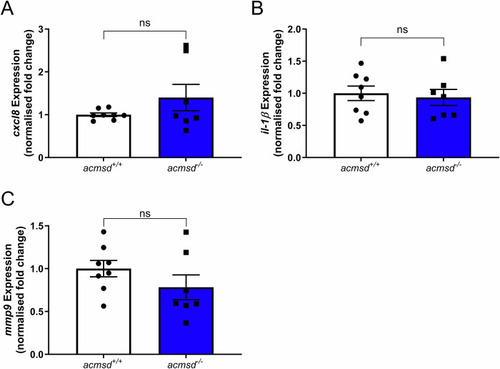
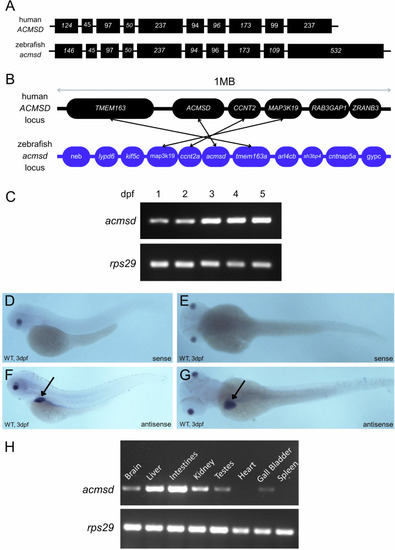
qPCR data suggested that genotype had no effect on the expression of cxcl8 (A, p = 0.9551, Mann Whitney test), il-1β (B, p = 0.7081, two-tailed unpaired t test), or mmp9 (C, p = 0.2200, two-tailed unpaired t test). n = 7 replicates for acmsd-/-; 8 replicates for acmsd+/+ (15 larvae per replicate).

EXPRESSION / LABELING:
Genes:
Fish:
Anatomical Term:
Stage: Day 5

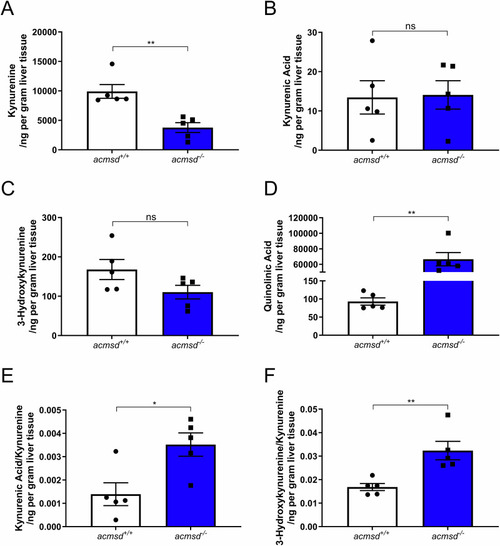
Kynurenine pathway metabolites were altered in acmsd-/- adult tissues.

In adult liver tissue, kynurenine was reduced in acmsd-/- zebrafish (A, p = 0.0079, Mann–Whitney test), no difference was identified between genotypes in kynurenic acid (B, p = 0.9125, unpaired, two-tailed t test) or 3-hydroxykynurenine (C, p = 0.0986, unpaired, two-tailed t test), whilst quinolinic acid was increased in acmsd-/- (D, p = 0.0079, Mann–Whitney test). The kynurenic acid: kynurenine ratio (E, p = 0.0161, unpaired, two-tailed t test) and the 3-hydroxykynurenine:kynurenine ratio (F, p = 0.0063, unpaired, two-tailed t test) were increased in acmsd-/- fish.

Summary of kynurenine pathway metabolite changes in acmsd-/- zebrafish.

A The basic kynurenine pathway. B Expected effect of reduced acmsd activity. C Results of metabolomics data from acmsd-/- zebrafish. Small arrows show measured changes in metabolites in acmsd-/- zebrafish compared to acmsd+/+. Arrow thickness represents pathway activity.

Acknowledgments
This image is the copyrighted work of the attributed author or publisher, and ZFIN has permission only to display this image to its users. Additional permissions should be obtained from the applicable author or publisher of the image. Full text @ NPJ Parkinsons Dis