
- Title
-
Single Molecule Fluorescence In Situ Hybridization Using RNAscope to Study Hematopoietic and Vascular Interactions in the Zebrafish Embryo and Larva
- Authors
- Torcq, L., Schmidt, A.A.
- Source
- Full text @ Bio Protoc
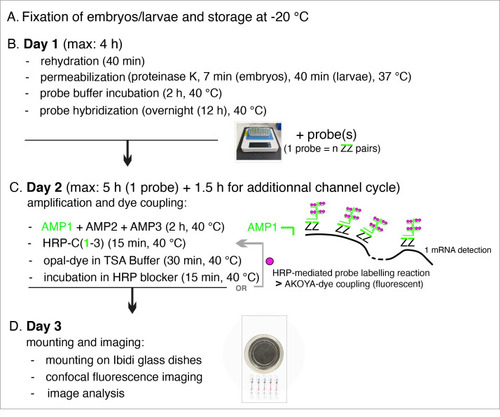
Summary of the main steps of the RNAscope procedure. AMP: signal AMPlifier (1, 2, or 3); HRP: HorseRadish peroxidase; HRP-C: HRP channel (1, 2, or 3); TSA: tyramide signal amplification; ZZ: pair of oligonucleotide probes [with target-specific binding sites covering regions of approximately 50 bases and mRNA target regions covering 300–1,000 nucleotides (with a pool of 6–20 ZZ pairs)]. OR + grey arrow indicates, on Day 2, the repeat of steps involved in additional fluorophore coupling using HRP activity in case of probe multiplexing using other channels (two times if two probes, three times if three probes) or interruption of the procedure until mounting of embryos/larvae on Day 3. |
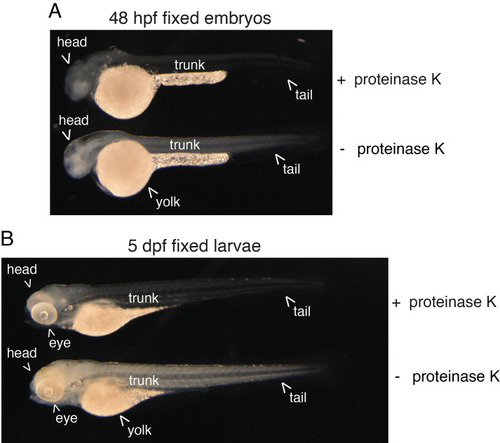
Efficiency of proteinase K digestion on the zebrafish embryo and larva. 48 hpf embryos (a) and 5 dpf larvae (b) were enzymatically digested or not (+ proteinase K, - proteinase K, respectively) after formaldehyde and methanol fixation. Note the effect of proteinase K treatment that is visualized by an increase in transparency of both the embryo and larva. In the embryo, the brain also appears more “milky,” which indicates the extreme limit of acceptable digestion. |
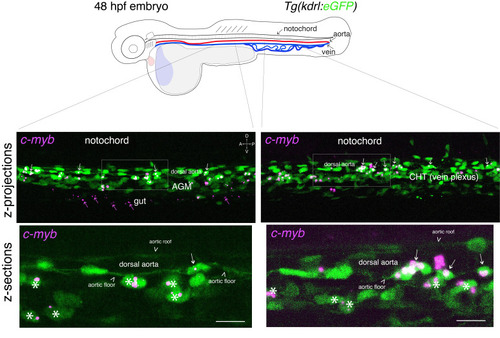
Whole-mount in situ analysis of . Top panel: schematic representation of a 48 hpf embryo (reproduced with modifications from [16]); red line = aorta (from which hematopoietic stem cell precursors emerge); blue line = vein (showing particularly the vein plexus, constituting the CHT). The embryo used expresses eGFP under the control of the vascular |
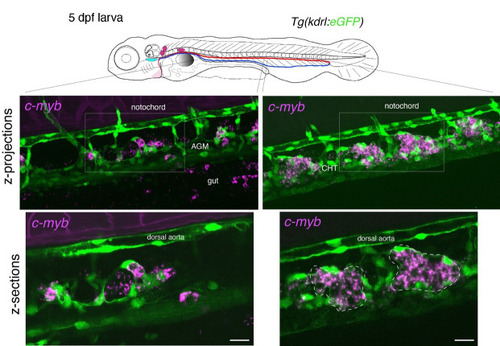
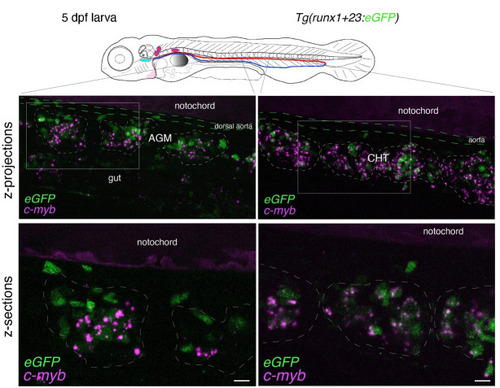
Whole-mount in situ analysis of . Top panel: schematic representation of a 5 dpf larva (reproduced with modifications from [16]); red line = aorta; blue line = vein. The larva used expresses eGFP under the control of the vascular |
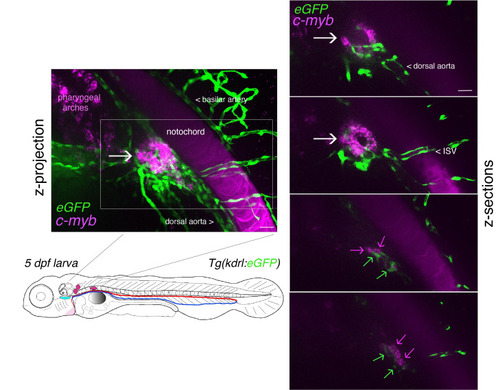
Whole-mount in situ analysis of RNAscope signals deep in the pronephros region of 5 dpf larvae using the Spinning disk confocal images obtained with a 5 dpf larva [ |
Whole-mount in situ analysis of Spinning disk confocal images obtained with a 5 dpf larva [ |
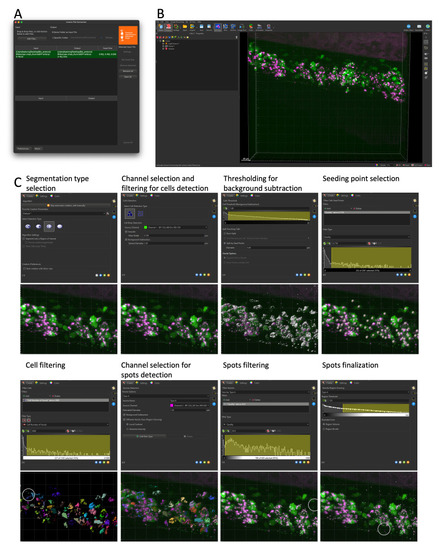
Cell and RNAscope segmentation workflow with Imaris. All data shown are extracted from a single caudal hematopoietic tissue (CHT) z-stack showing the expression of |
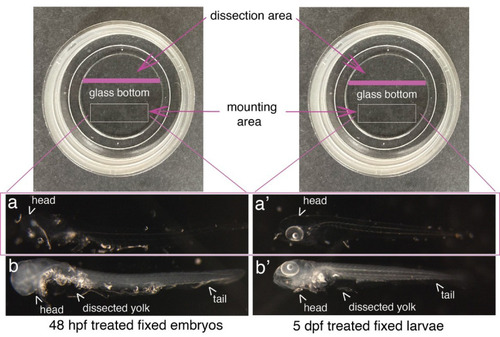
Mounting of embryos and larvae after RNAscope reagents treatment. Top images show Ibidi dishes, with the recommended dissection area on the top and the agarose mounting area at the bottom (white rectangles). 48 hpf embryos (a, b) and 5 dpf larvae (a’, b’) were either (a, a’) or not (b, b’) treated with proteinase K and all of them with RNAscope reagents. Images show that the whole procedure leads to virtually total transparency of the specimen, which reaches a maximum for embryos [becoming barely visible as in (a)]. This transparency requires controlling all steps of reagent/buffer removal under the binoculars. Yolks were dissected, as well as the eyes facing the glass bottom of the dish to ensure flatness. |
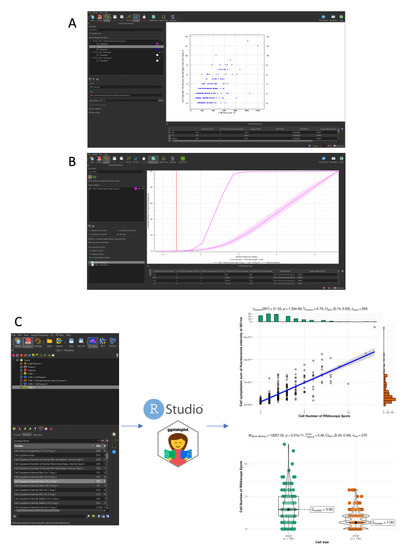
Spatial analysis and plotting of gene expression data. All data plotted are extracted from a single caudal hematopoietic tissue (CHT) z-stack showing the expression of |
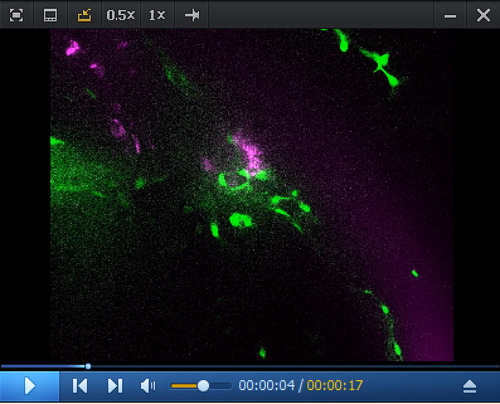
RNAscope in situ Spinning disk confocal images (z-stack) obtained from a 5 dpf |
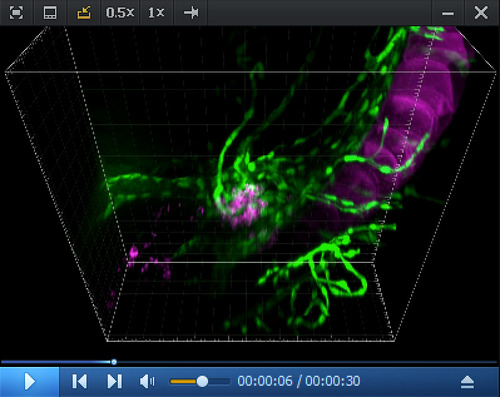
Imaris 3D reconstitution of RNAscope in situ 3D rendering (reconstituted with the Imaris software) obtained from a spinning disk confocal image (z-stack) obtained from a 5 dpf |
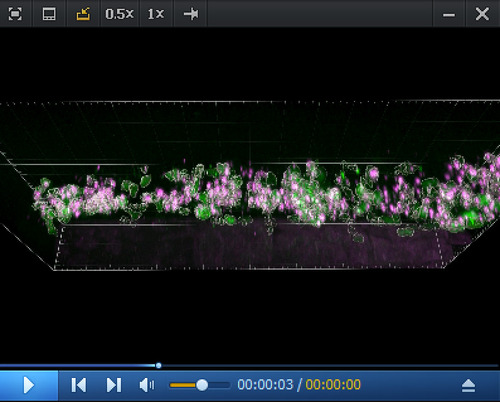
Imaris 3D rendering and colocalization of RNAscope spots and hematopoietic stem and progenitor cells (HSPCs) in the CHT region. 3D reconstitution generated from a spinning disk confocal z-stack obtained from a 5 dpf |