
FIGURE
Figure 7.
- ID
- ZDB-FIG-250415-83
- Publication
- Torcq et al., 2025 - Single Molecule Fluorescence In Situ Hybridization Using RNAscope to Study Hematopoietic and Vascular Interactions in the Zebrafish Embryo and Larva
- Other Figures
- All Figure Page
- Back to All Figure Page
Figure 7.
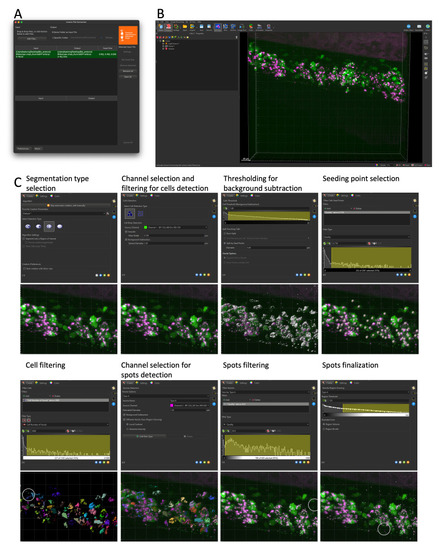
Cell and RNAscope segmentation workflow with Imaris. All data shown are extracted from a single caudal hematopoietic tissue (CHT) z-stack showing the expression of |
Expression Data
Expression Detail
Antibody Labeling
Phenotype Data
Phenotype Detail
Acknowledgments
This image is the copyrighted work of the attributed author or publisher, and
ZFIN has permission only to display this image to its users.
Additional permissions should be obtained from the applicable author or publisher of the image.
Full text @ Bio Protoc