FIGURE

Figure 9.

ID
ZDB-FIG-250415-86
Publication
Torcq et al., 2025 - Single Molecule Fluorescence In Situ Hybridization Using RNAscope to Study Hematopoietic and Vascular Interactions in the Zebrafish Embryo and Larva
Other Figures
All Figure Page
Back to All Figure Page
Figure 9.

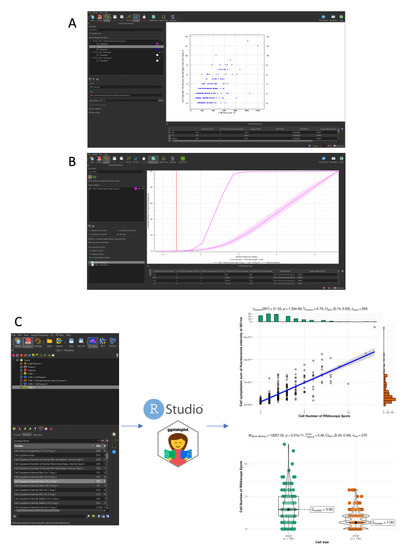
Spatial analysis and plotting of gene expression data.

All data plotted are extracted from a single caudal hematopoietic tissue (CHT) z-stack showing the expression of cmyb (RNAscope spots) in hematopoietic cells expressing eGFP under the control of the runx1+23 enhancer. (A) Imaris Vantage 2D plotting, cell number of RNAscope spots relative to the cell area (µm). (B) Imaris vantage cumulative distribution function (CDF) plotting, cumulative number of spots percentage relative to the shortest distance to cell surface (µm). Solid pink line: our data; dashed pink line and light pink interval: confidence interval’s random distribution; red vertical line: calculated attraction distance. (C) Data extraction from Imaris and plotting in R studio using the ggstatsplot package. Top plot shows the correlation between cell size (µm) and number of spots per cell. Bottom plot shows the number of spots per cell depending on cell size [large cell > 11,490 voxels (corresponding to the median cell size), small cells < 11,490 voxels]. The code to generate the plots is given in Data analysis, section C.

Expression Data

Expression Detail
Antibody Labeling
Phenotype Data

Phenotype Detail
Acknowledgments
This image is the copyrighted work of the attributed author or publisher, and ZFIN has permission only to display this image to its users. Additional permissions should be obtained from the applicable author or publisher of the image. Full text @ Bio Protoc