
|
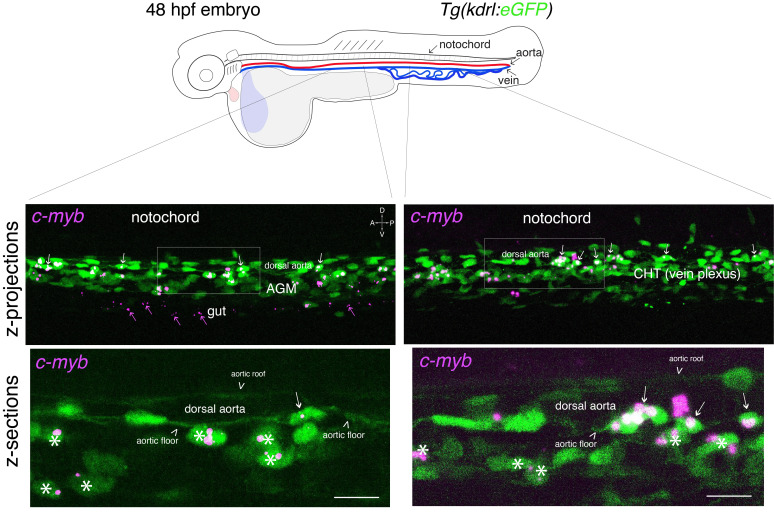
Figure 3.
Whole-mount in situ analysis of
. Top panel: schematic representation of a 48 hpf embryo (reproduced with modifications from [16]); red line = aorta (from which hematopoietic stem cell precursors emerge); blue line = vein (showing particularly the vein plexus, constituting the CHT). The embryo used expresses eGFP under the control of the vascular